AnalytiXIN Data Explorer for the Terra Platform
Empowering Data-Driven Decision Making Through Intuitive Analytics
Overview
My role: Product Designer
Timeline: 12 months (Discovery to MVP Launch)
Team: Cross-functional team of 21 (Product, Engineering, Data Science )
Focus Areas: Enterprise Analytics Interface, Data Exploration Workflows, Business Intelligence UX
The Challenge
Data scientists using AnalytiXIN needed an efficient way to explore and analyze complex datasets without requiring deep technical expertise. The existing data exploration process was fragmented across multiple tools and required advanced query knowledge, creating barriers for analysts to quickly derive actionable insights.
Key Problems:
Complex data query and filtering requirements
Difficulty navigating large, multi-dimensional datasets
Need for both simple exploration and advanced analytics capabilities
Business users required intuitive interface without losing analytical depth
The Solution
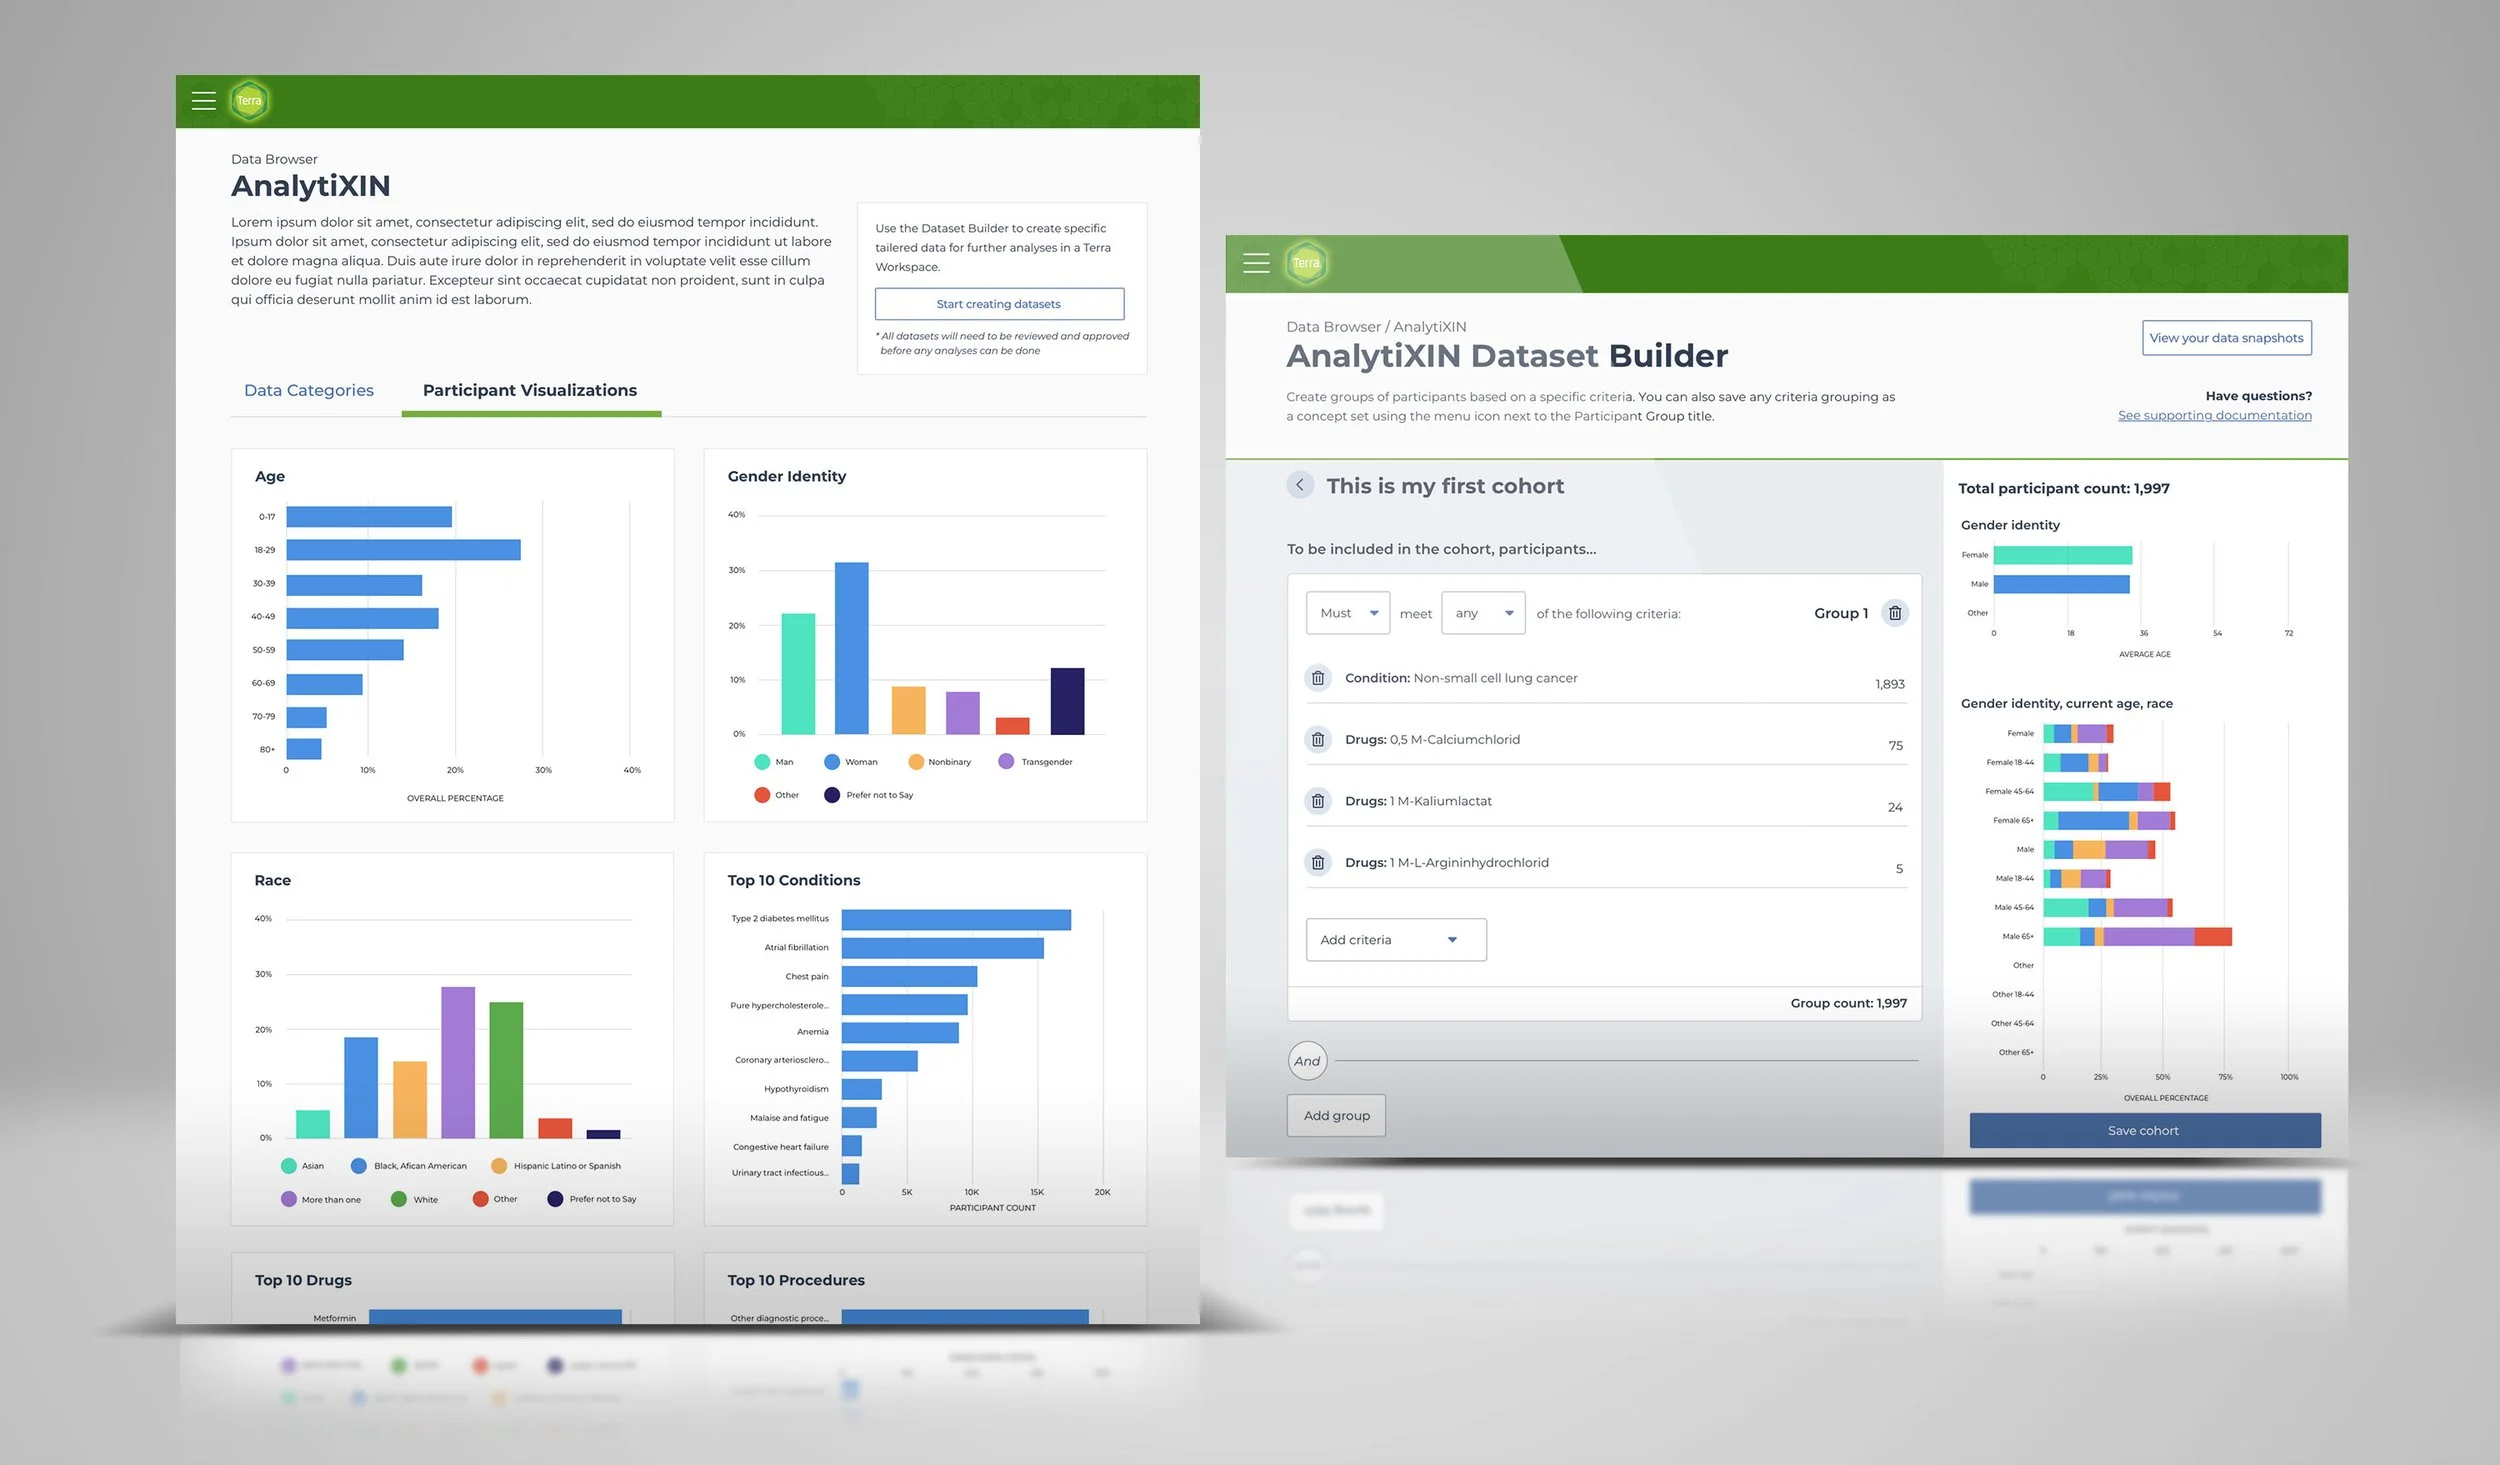
Data Explorer: A Point-and-Click Analytics Platform
Designed a comprehensive interface enabling analysts to explore datasets through an intuitive, guided workflow within the AnalytiXIN platform.
Core Features:
Guided Data Selection: Drop-down menus organizing data by categories, domains, and metrics
Flexible Search & Browse: Multiple pathways to discover relevant data dimensions
Smart Filters: Context-sensitive options for refining data exploration
Visual Query Builder: Drag-and-drop interface for creating complex data relationships
Logical Operators: Clear AND/OR filter relationships for sophisticated data analysis
User Workflow:
Create & Define: Add inclusion criteria from organized data categories
Search & Select: Browse data domains and metrics relevant to business objectives
Refine & Filter: Apply specific parameters and advanced filtering options
Review & Validate: Data preview functionality for criteria validation
Save & Execute: Finalize queries with clear logical relationships and export options
Key Design Decisions
Decision 1: Inclusion-First Data Approach
Always start with data analysts want to include in their analysis
Prevents negative filtering patterns that could miss important insights
Decision 2: Dual-Mode Architecture
Separate simple exploration mode from advanced analytics mode
Allows focused workflows without overwhelming novice users
Decision 3: Progressive Disclosure
Surface common data filters first, with advanced options available on-demand
Accommodates both business analysts and data scientists
Impact
Analyst Efficiency:
Streamlined data exploration process
Reduced technical barriers for business analysts
Enabled sophisticated analysis without requiring SQL knowledge
Data Quality:
Clear filter documentation for reproducible analyses
Built-in validation through data preview functionality
Support for complex filtering logic (AND/OR criteria)
Platform Adoption:
Intuitive interface lowered entry barriers for new analysts
Point-and-click functionality democratized access to enterprise data
Key Learnings
Domain Expertise Matters: Business analysts think in terms of inclusion/exclusion criteria for data exploration - the interface needed to mirror this mental model rather than technical database concepts.
Progressive Complexity: Starting simple with the ability to add sophistication allowed analysts to grow into the tool's full capabilities.
Workflow Integration: The Data Explorer's effectiveness came from its seamless integration with visualization and reporting tools, creating a complete analytics workflow rather than isolated functionality.
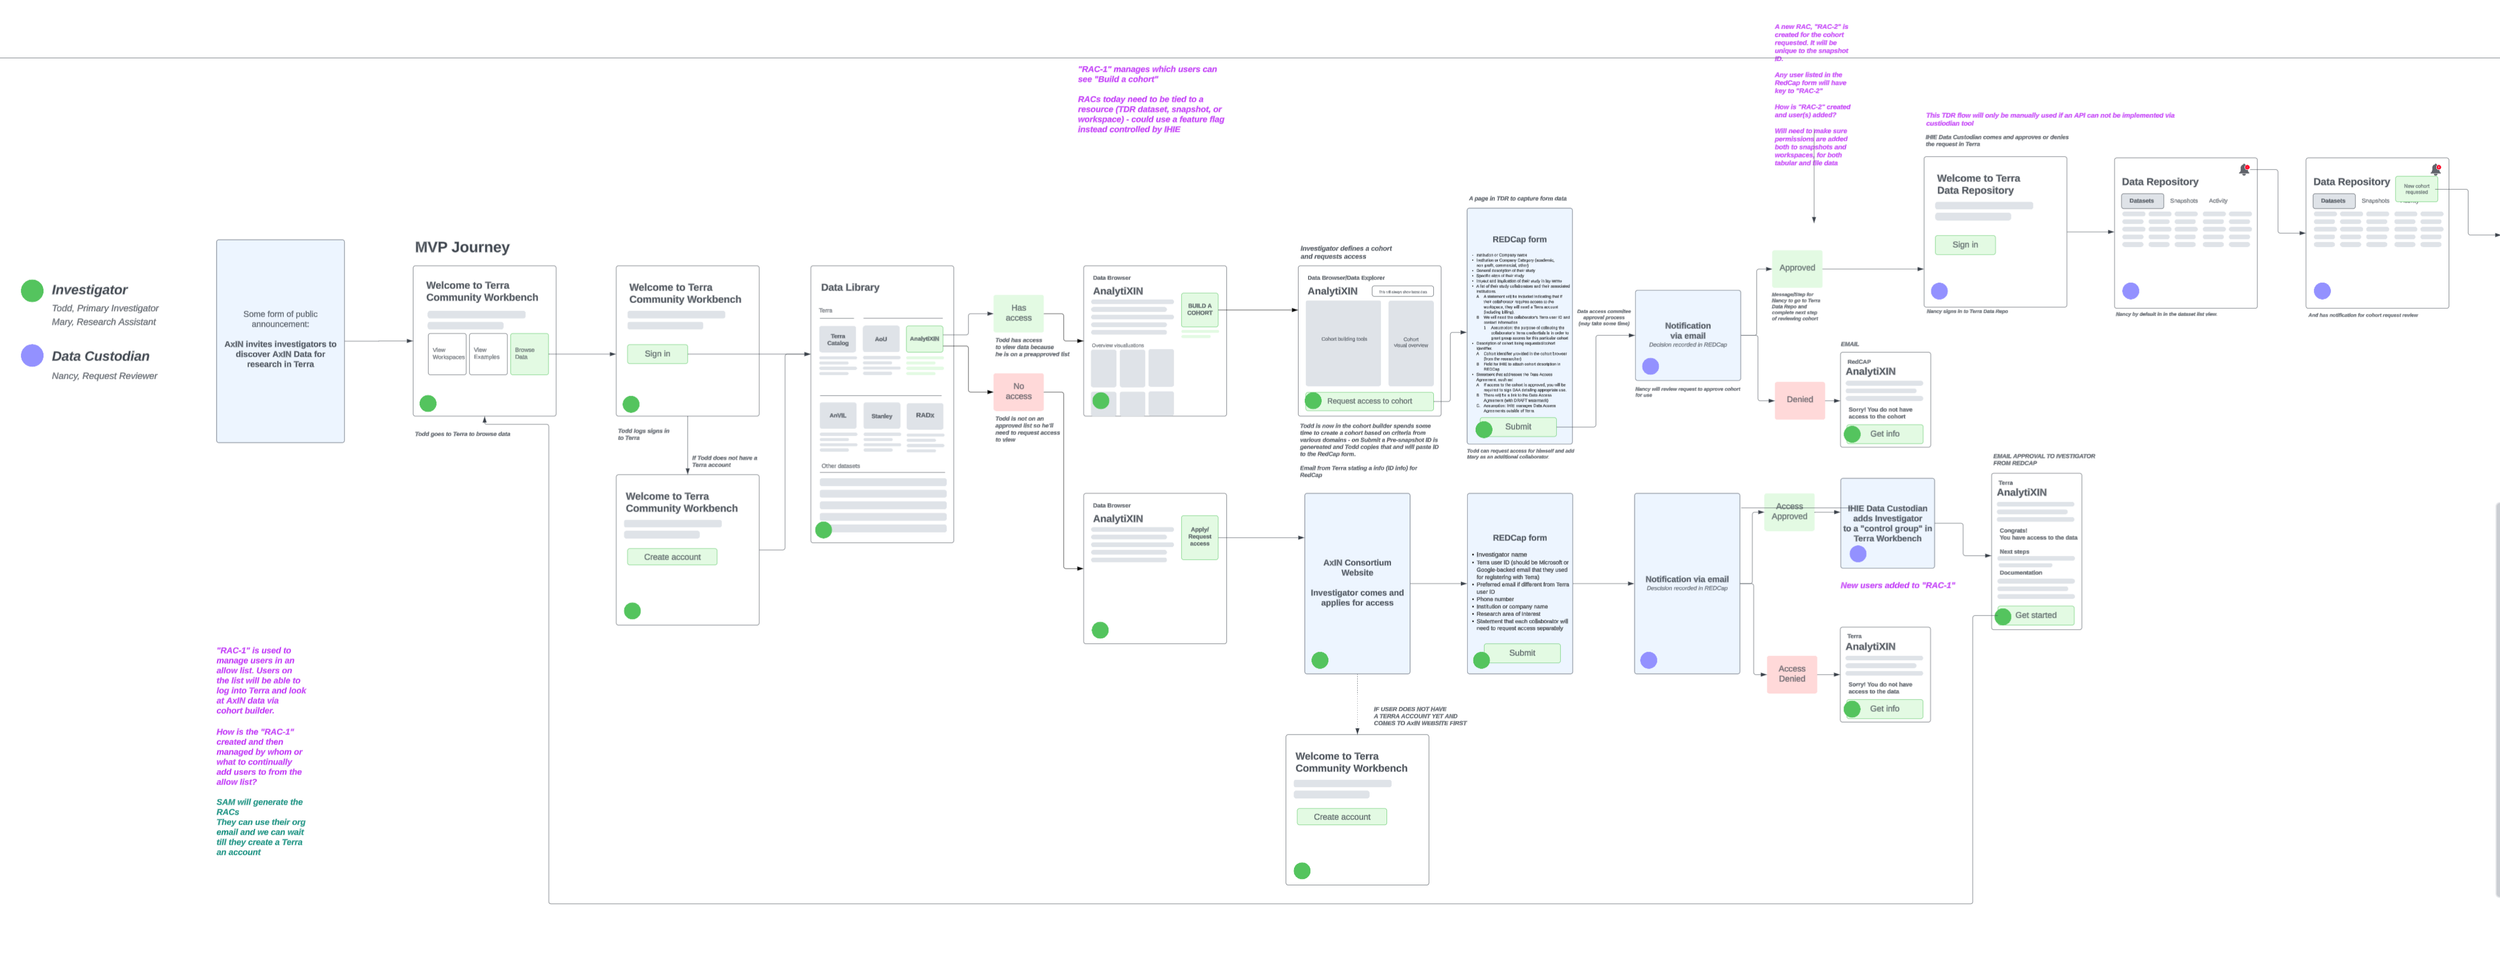
Sketching user journeys
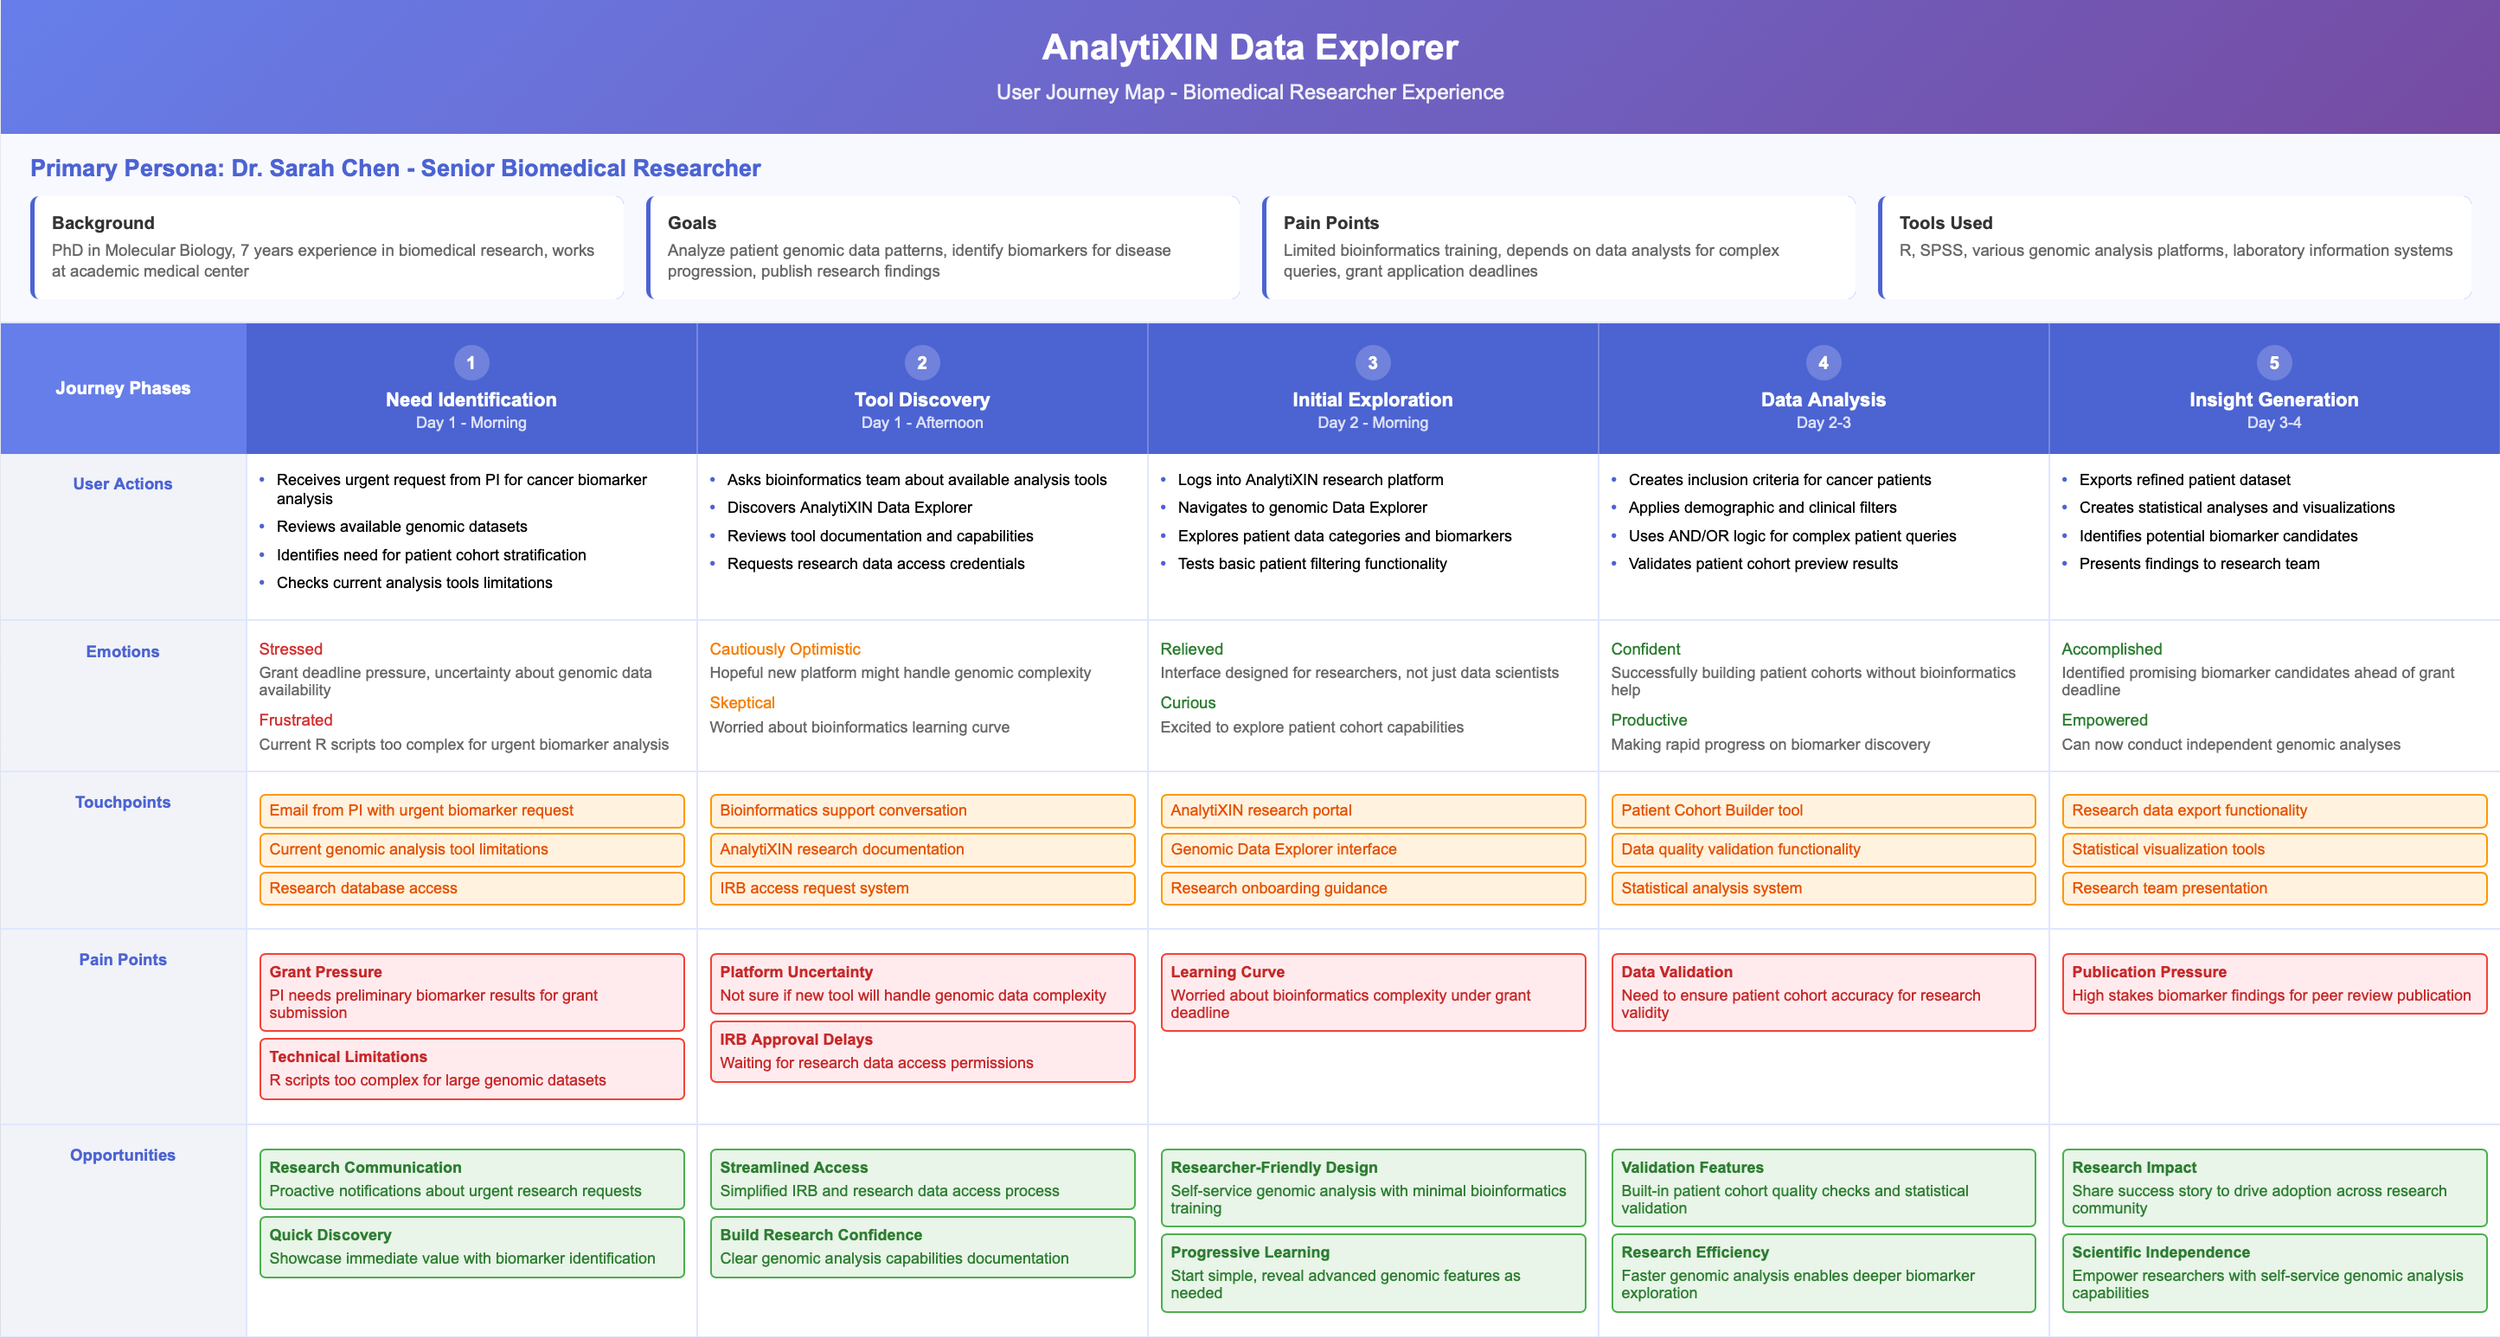
User journey persona and journey map
Journey flow
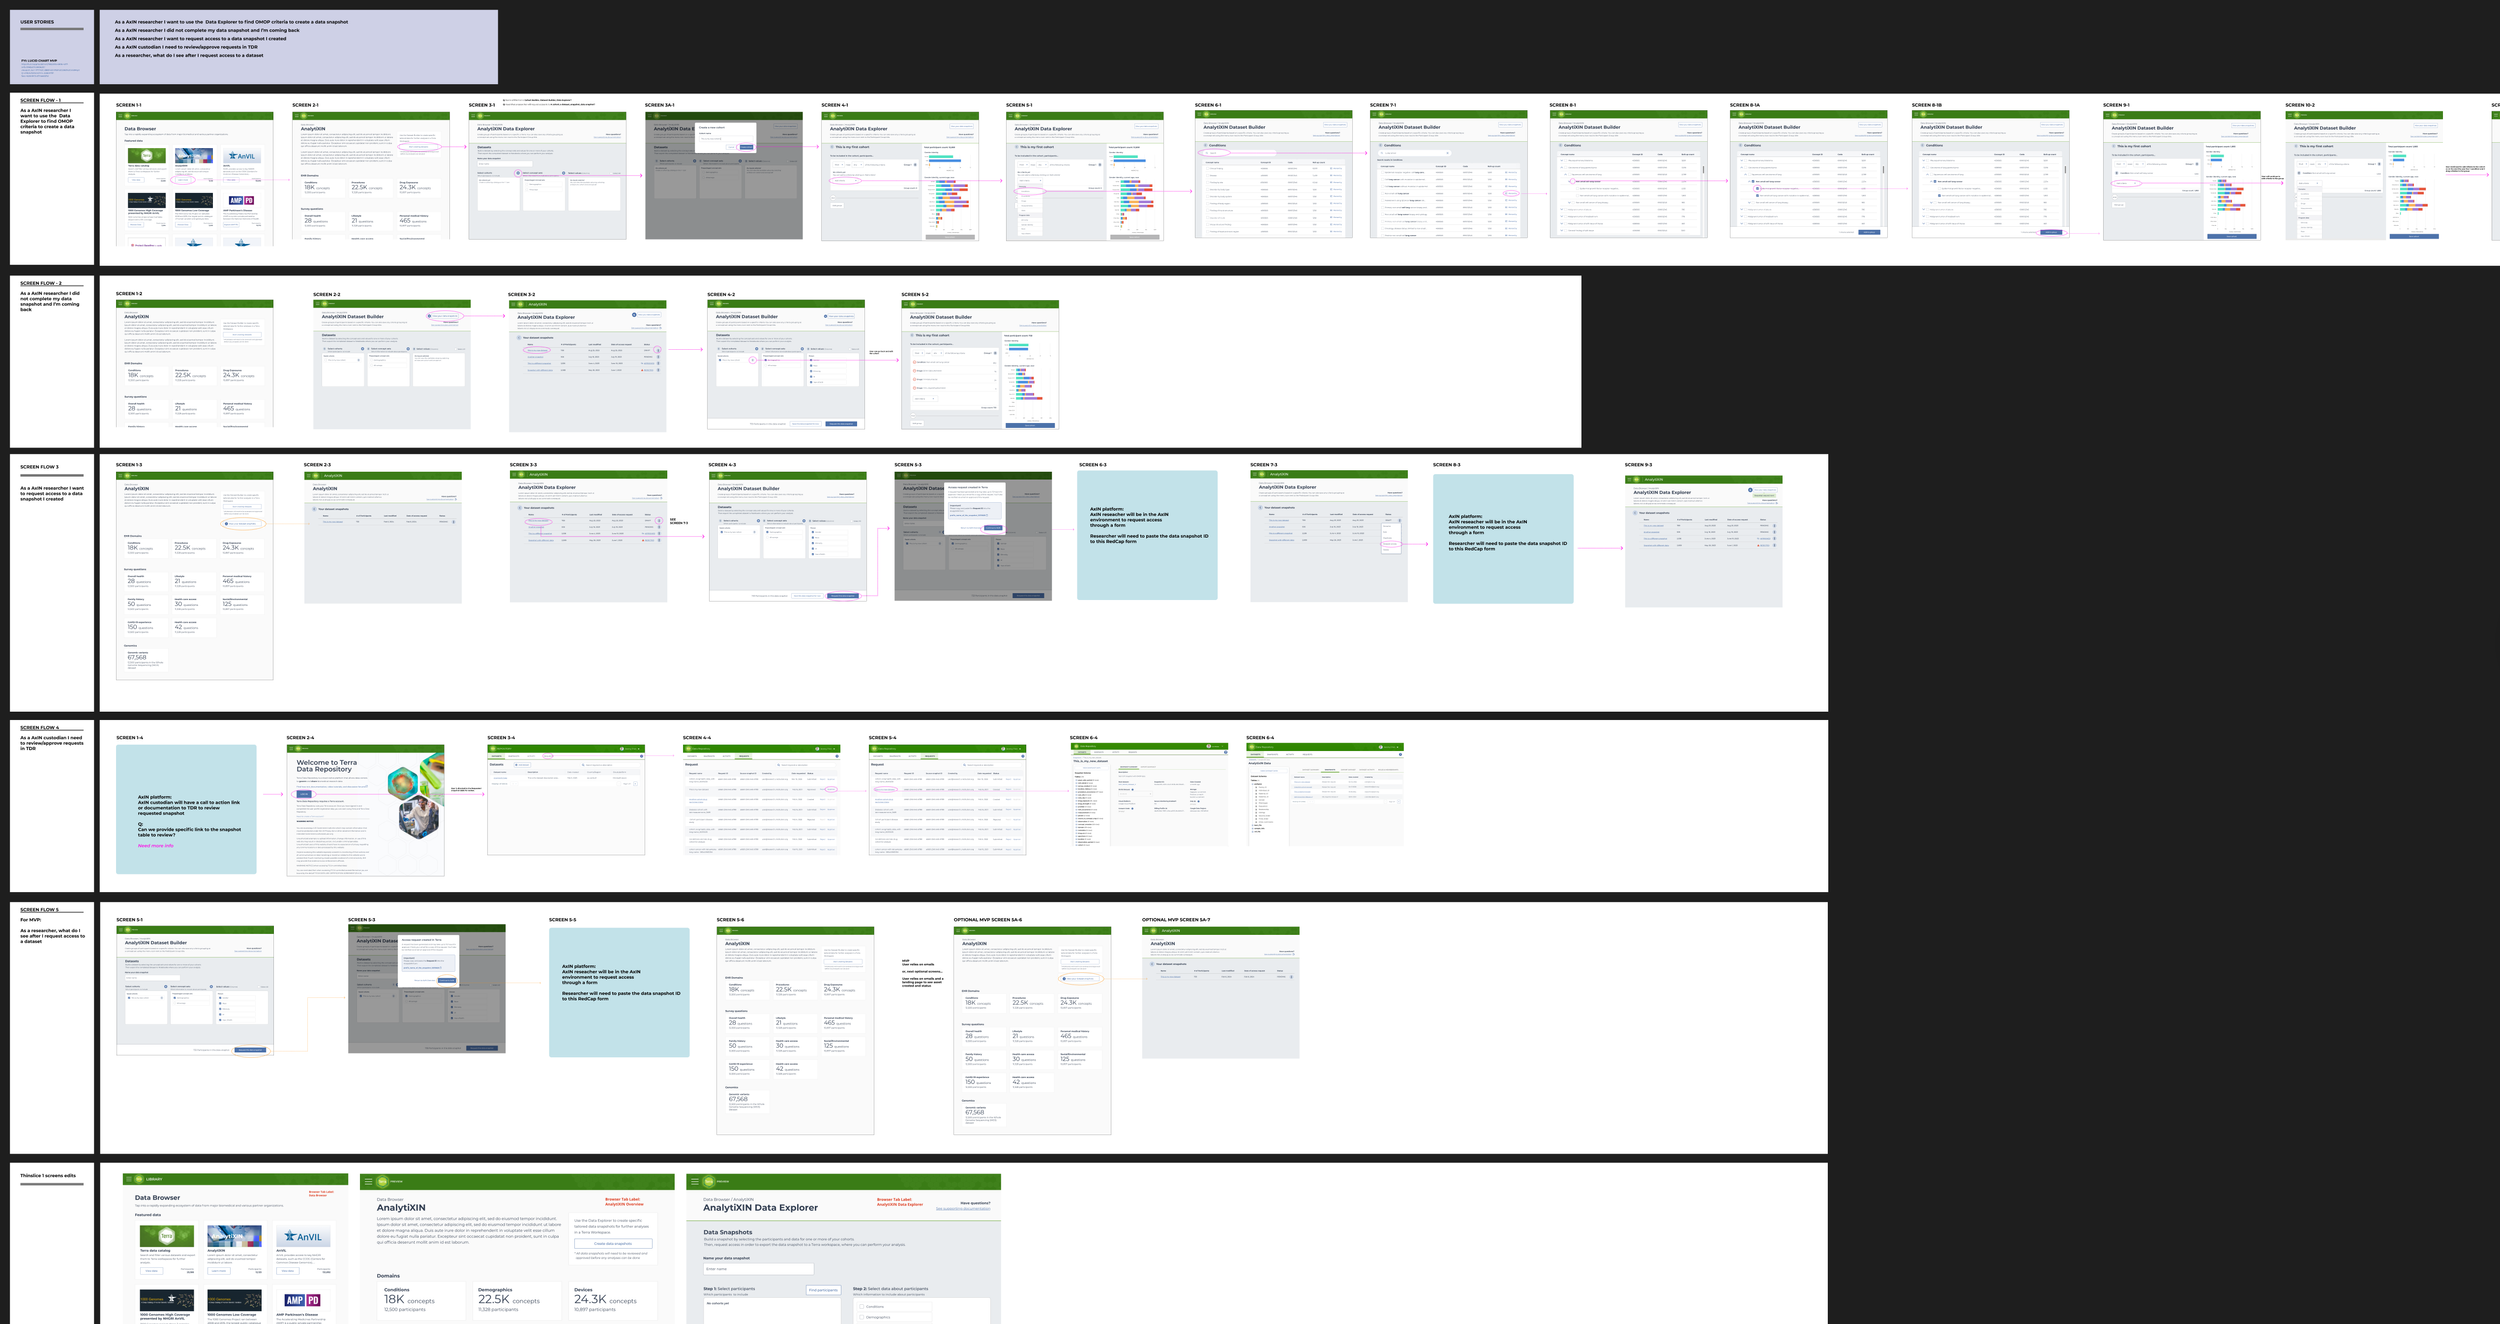
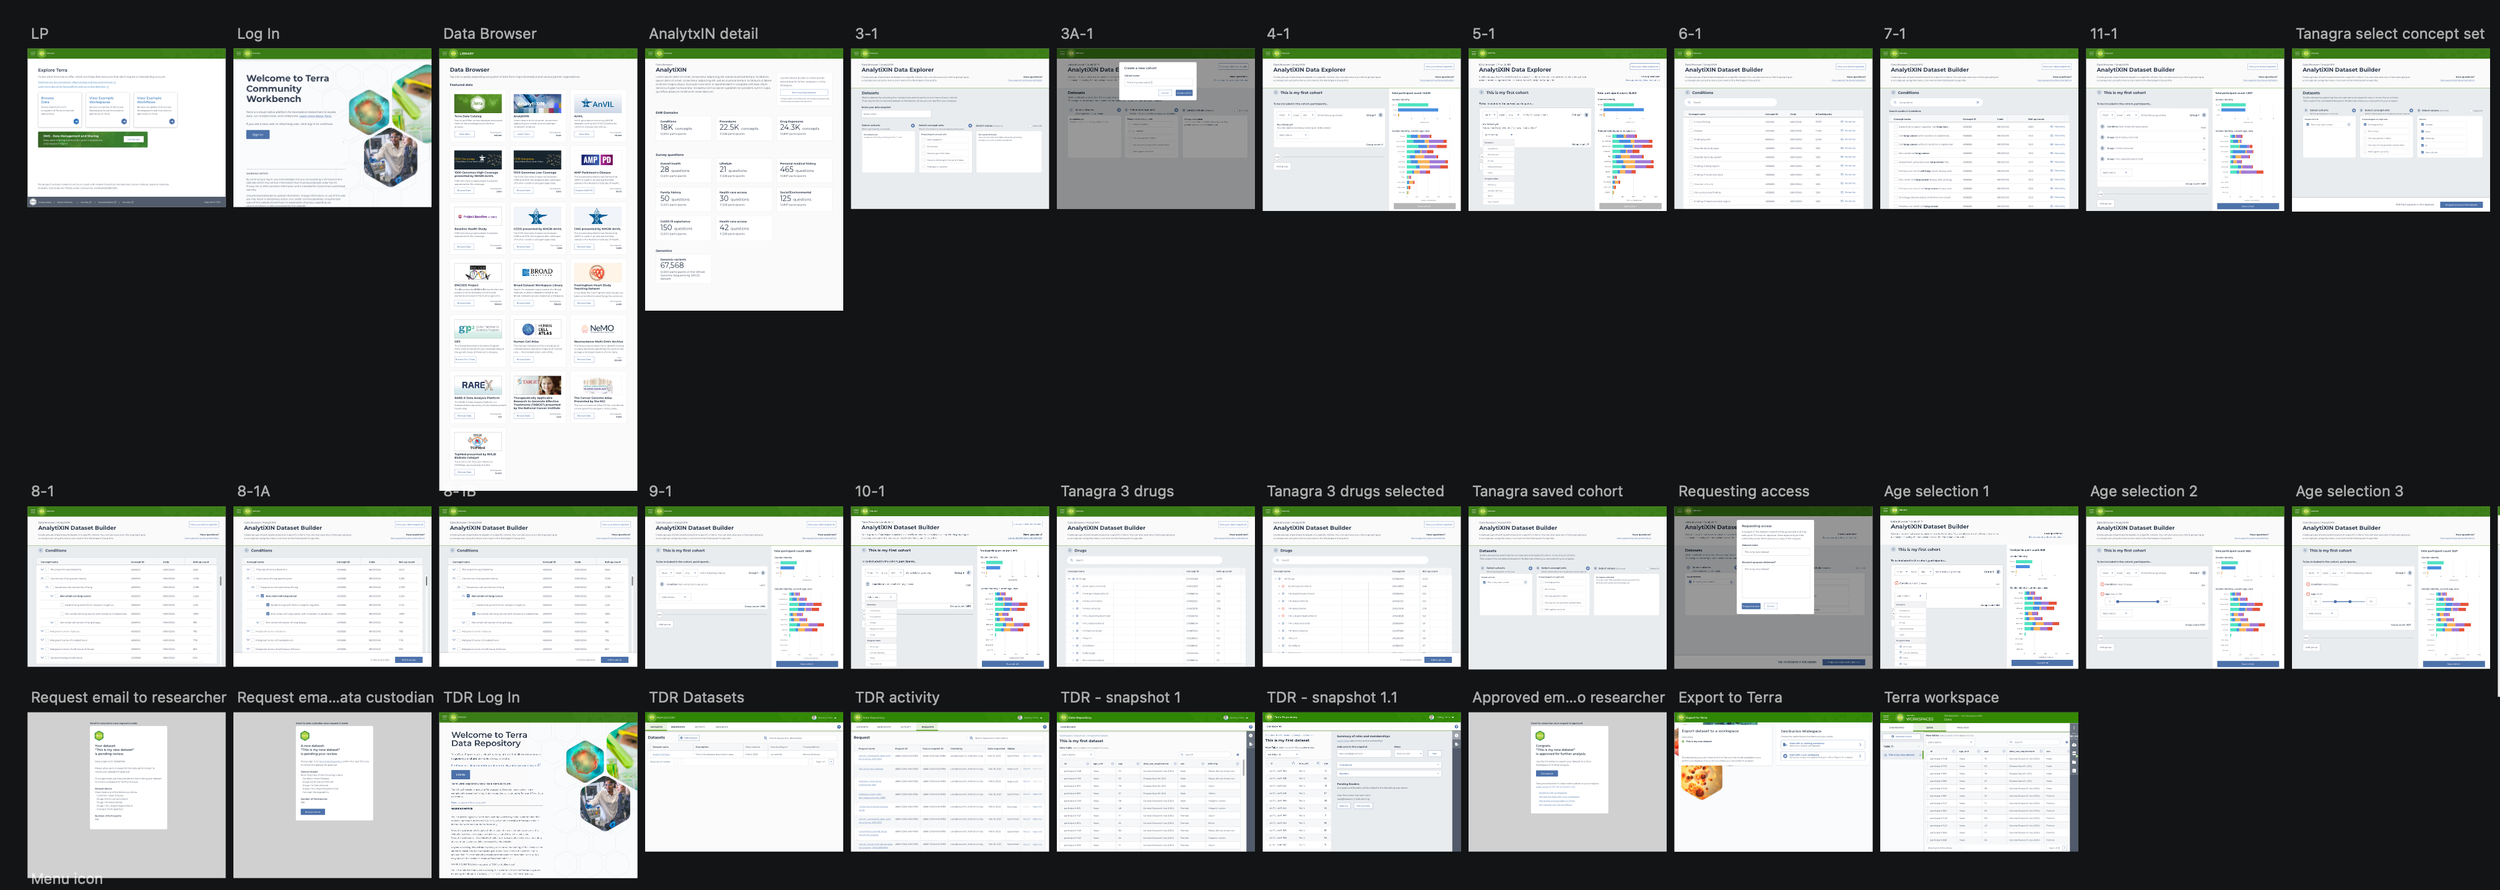
Mapping out user journeys for Jira stories
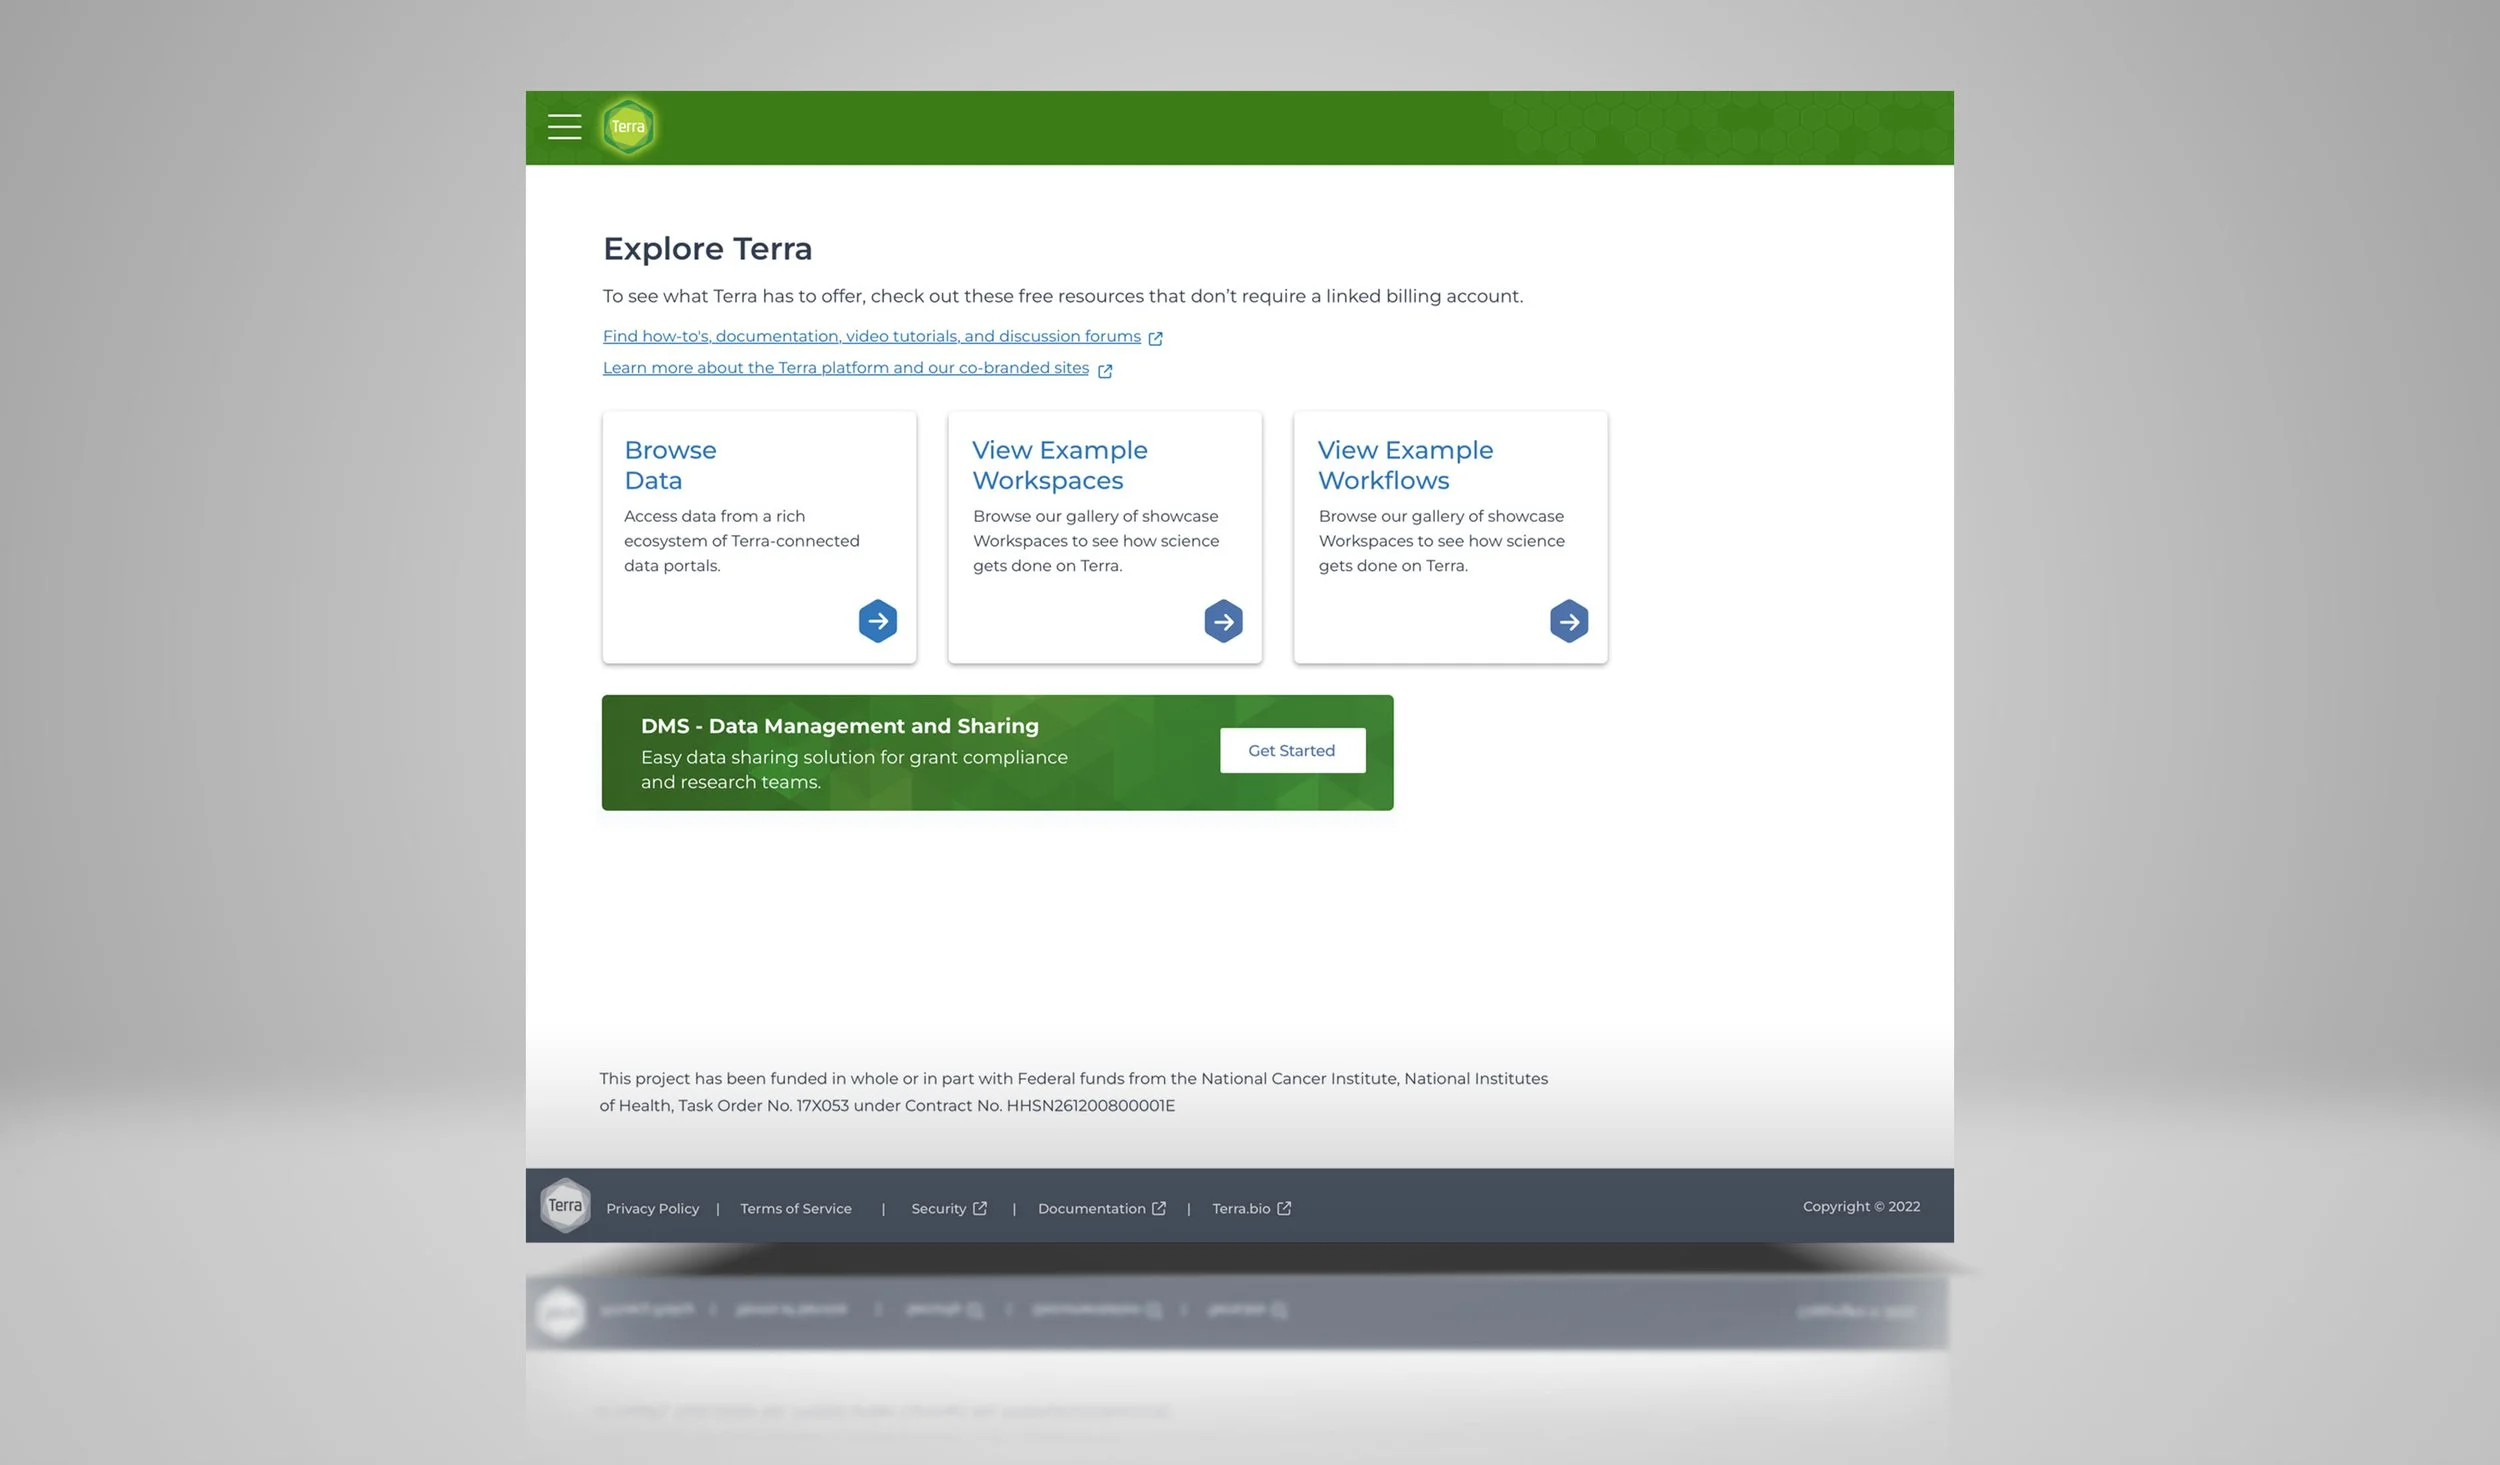
Exploring Terra LP
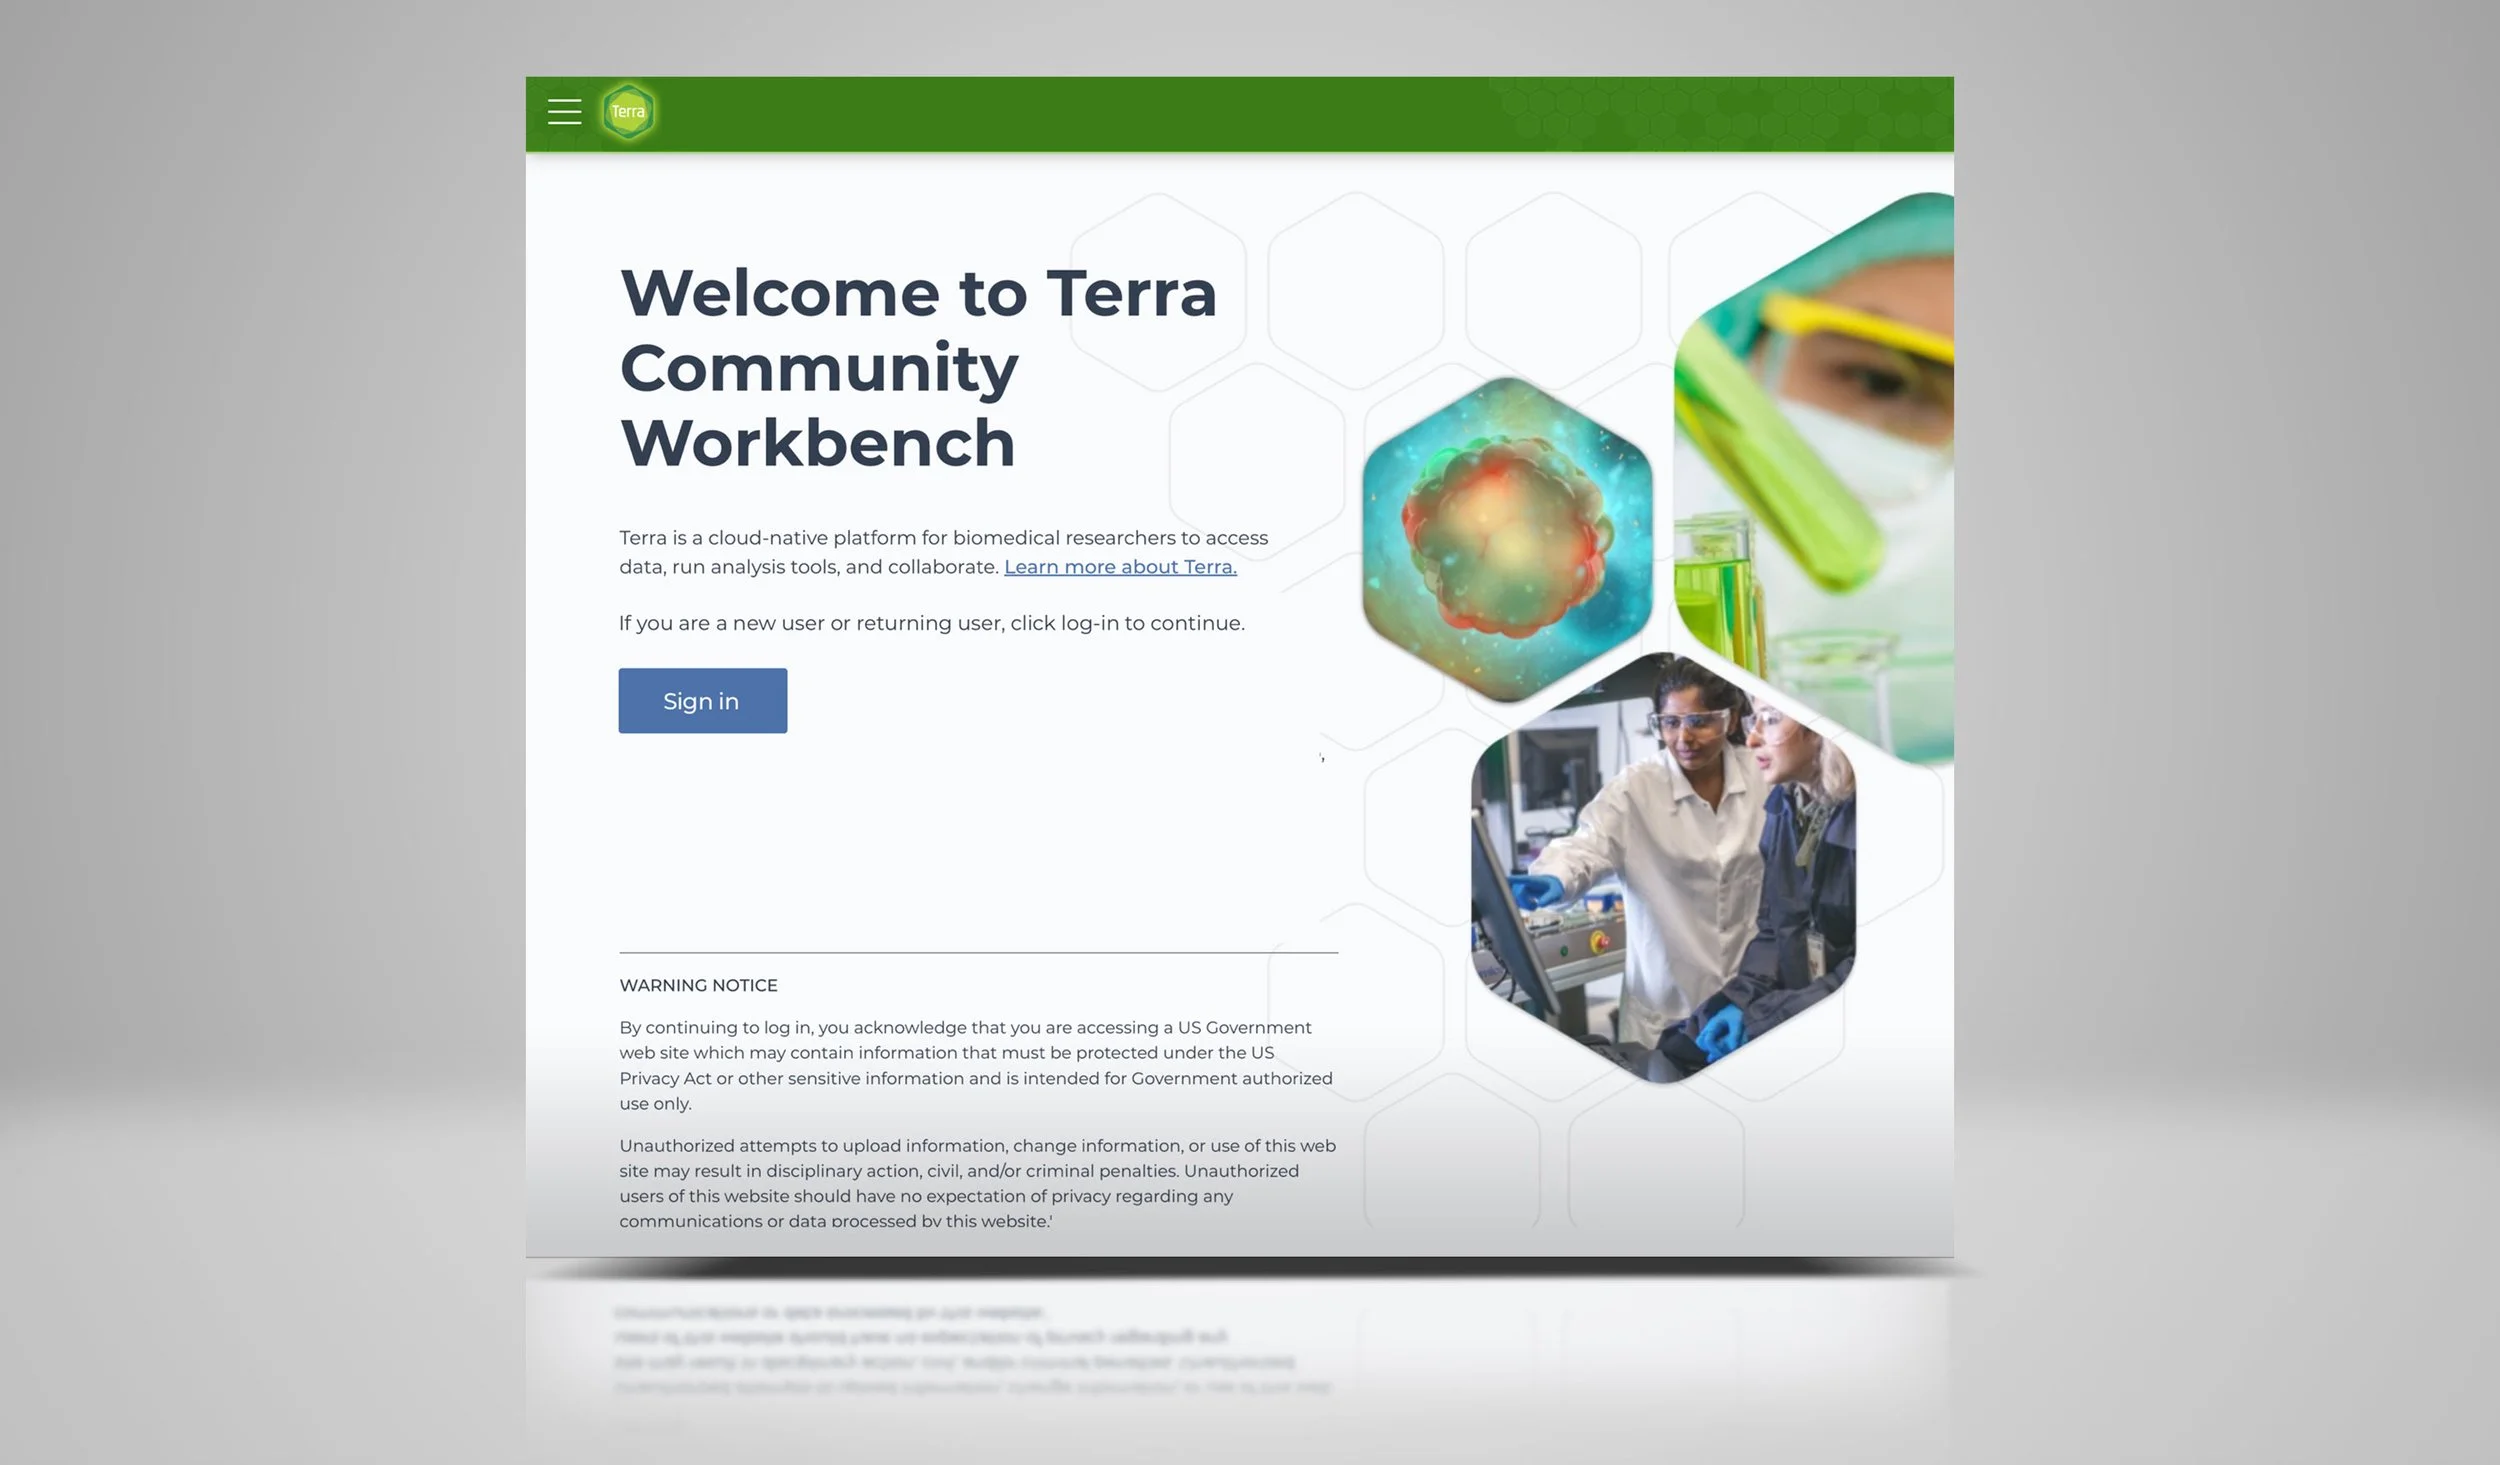
Sign in to Terra
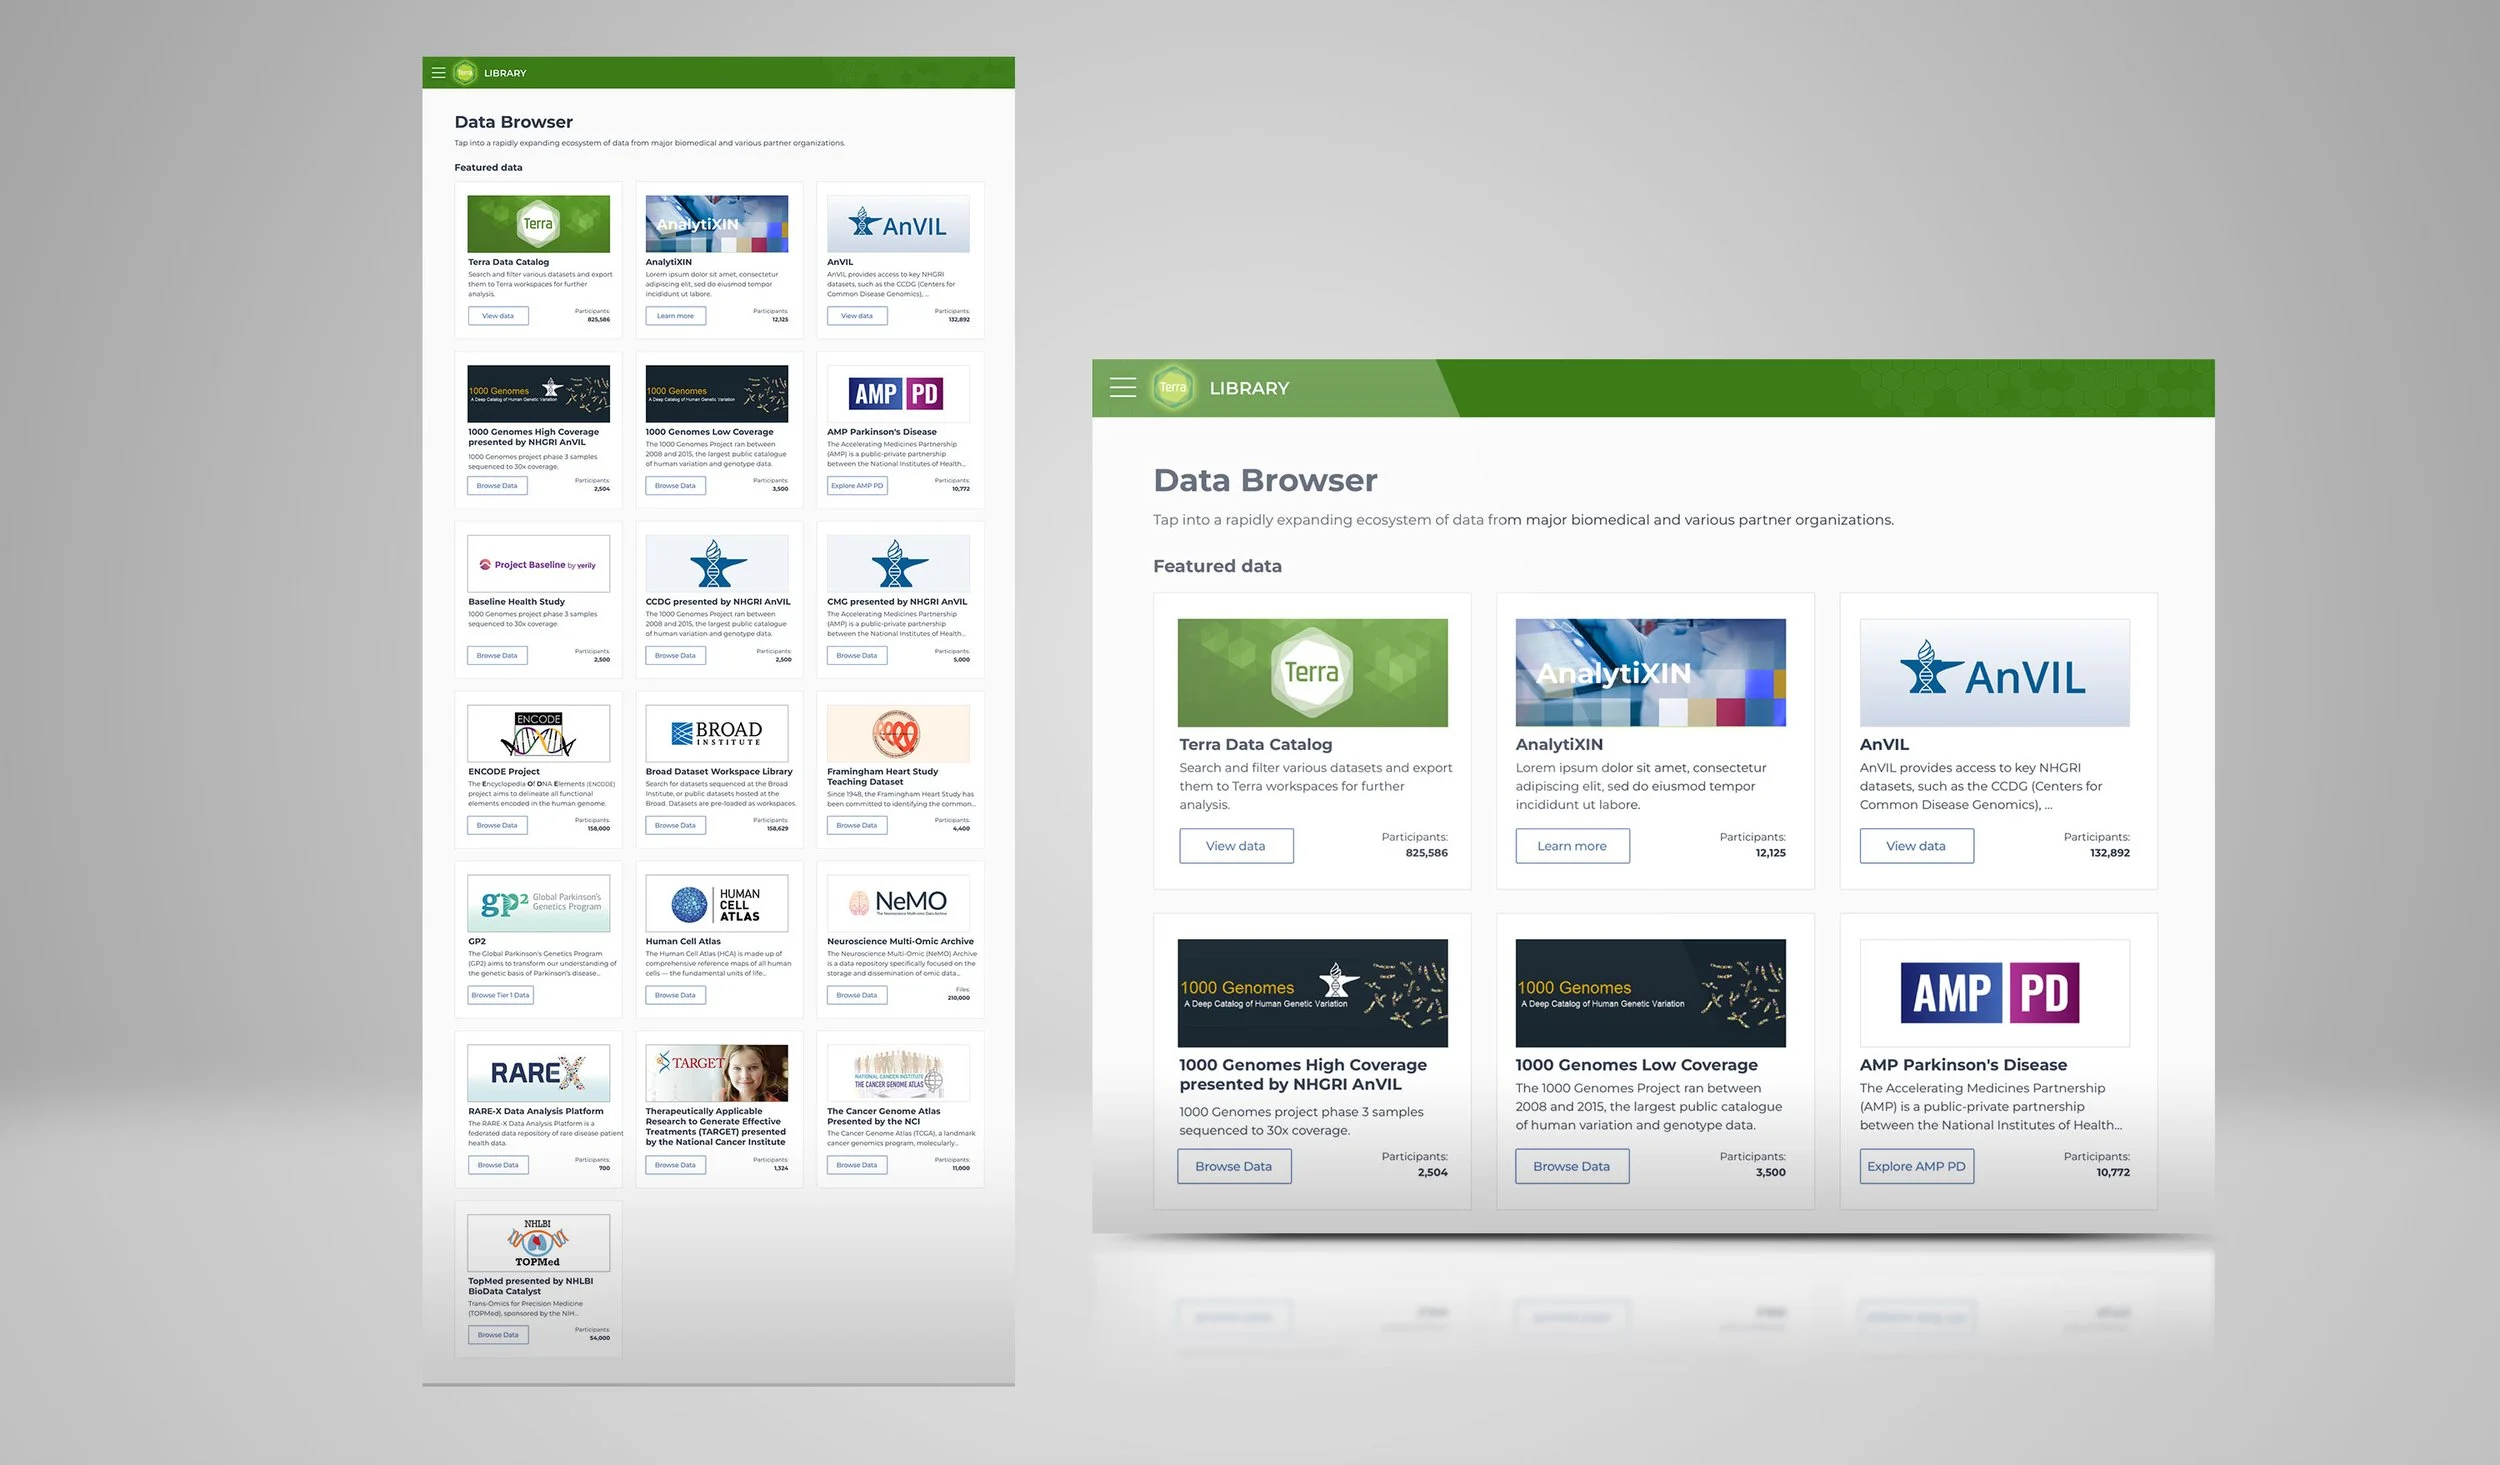
Terra Data Library
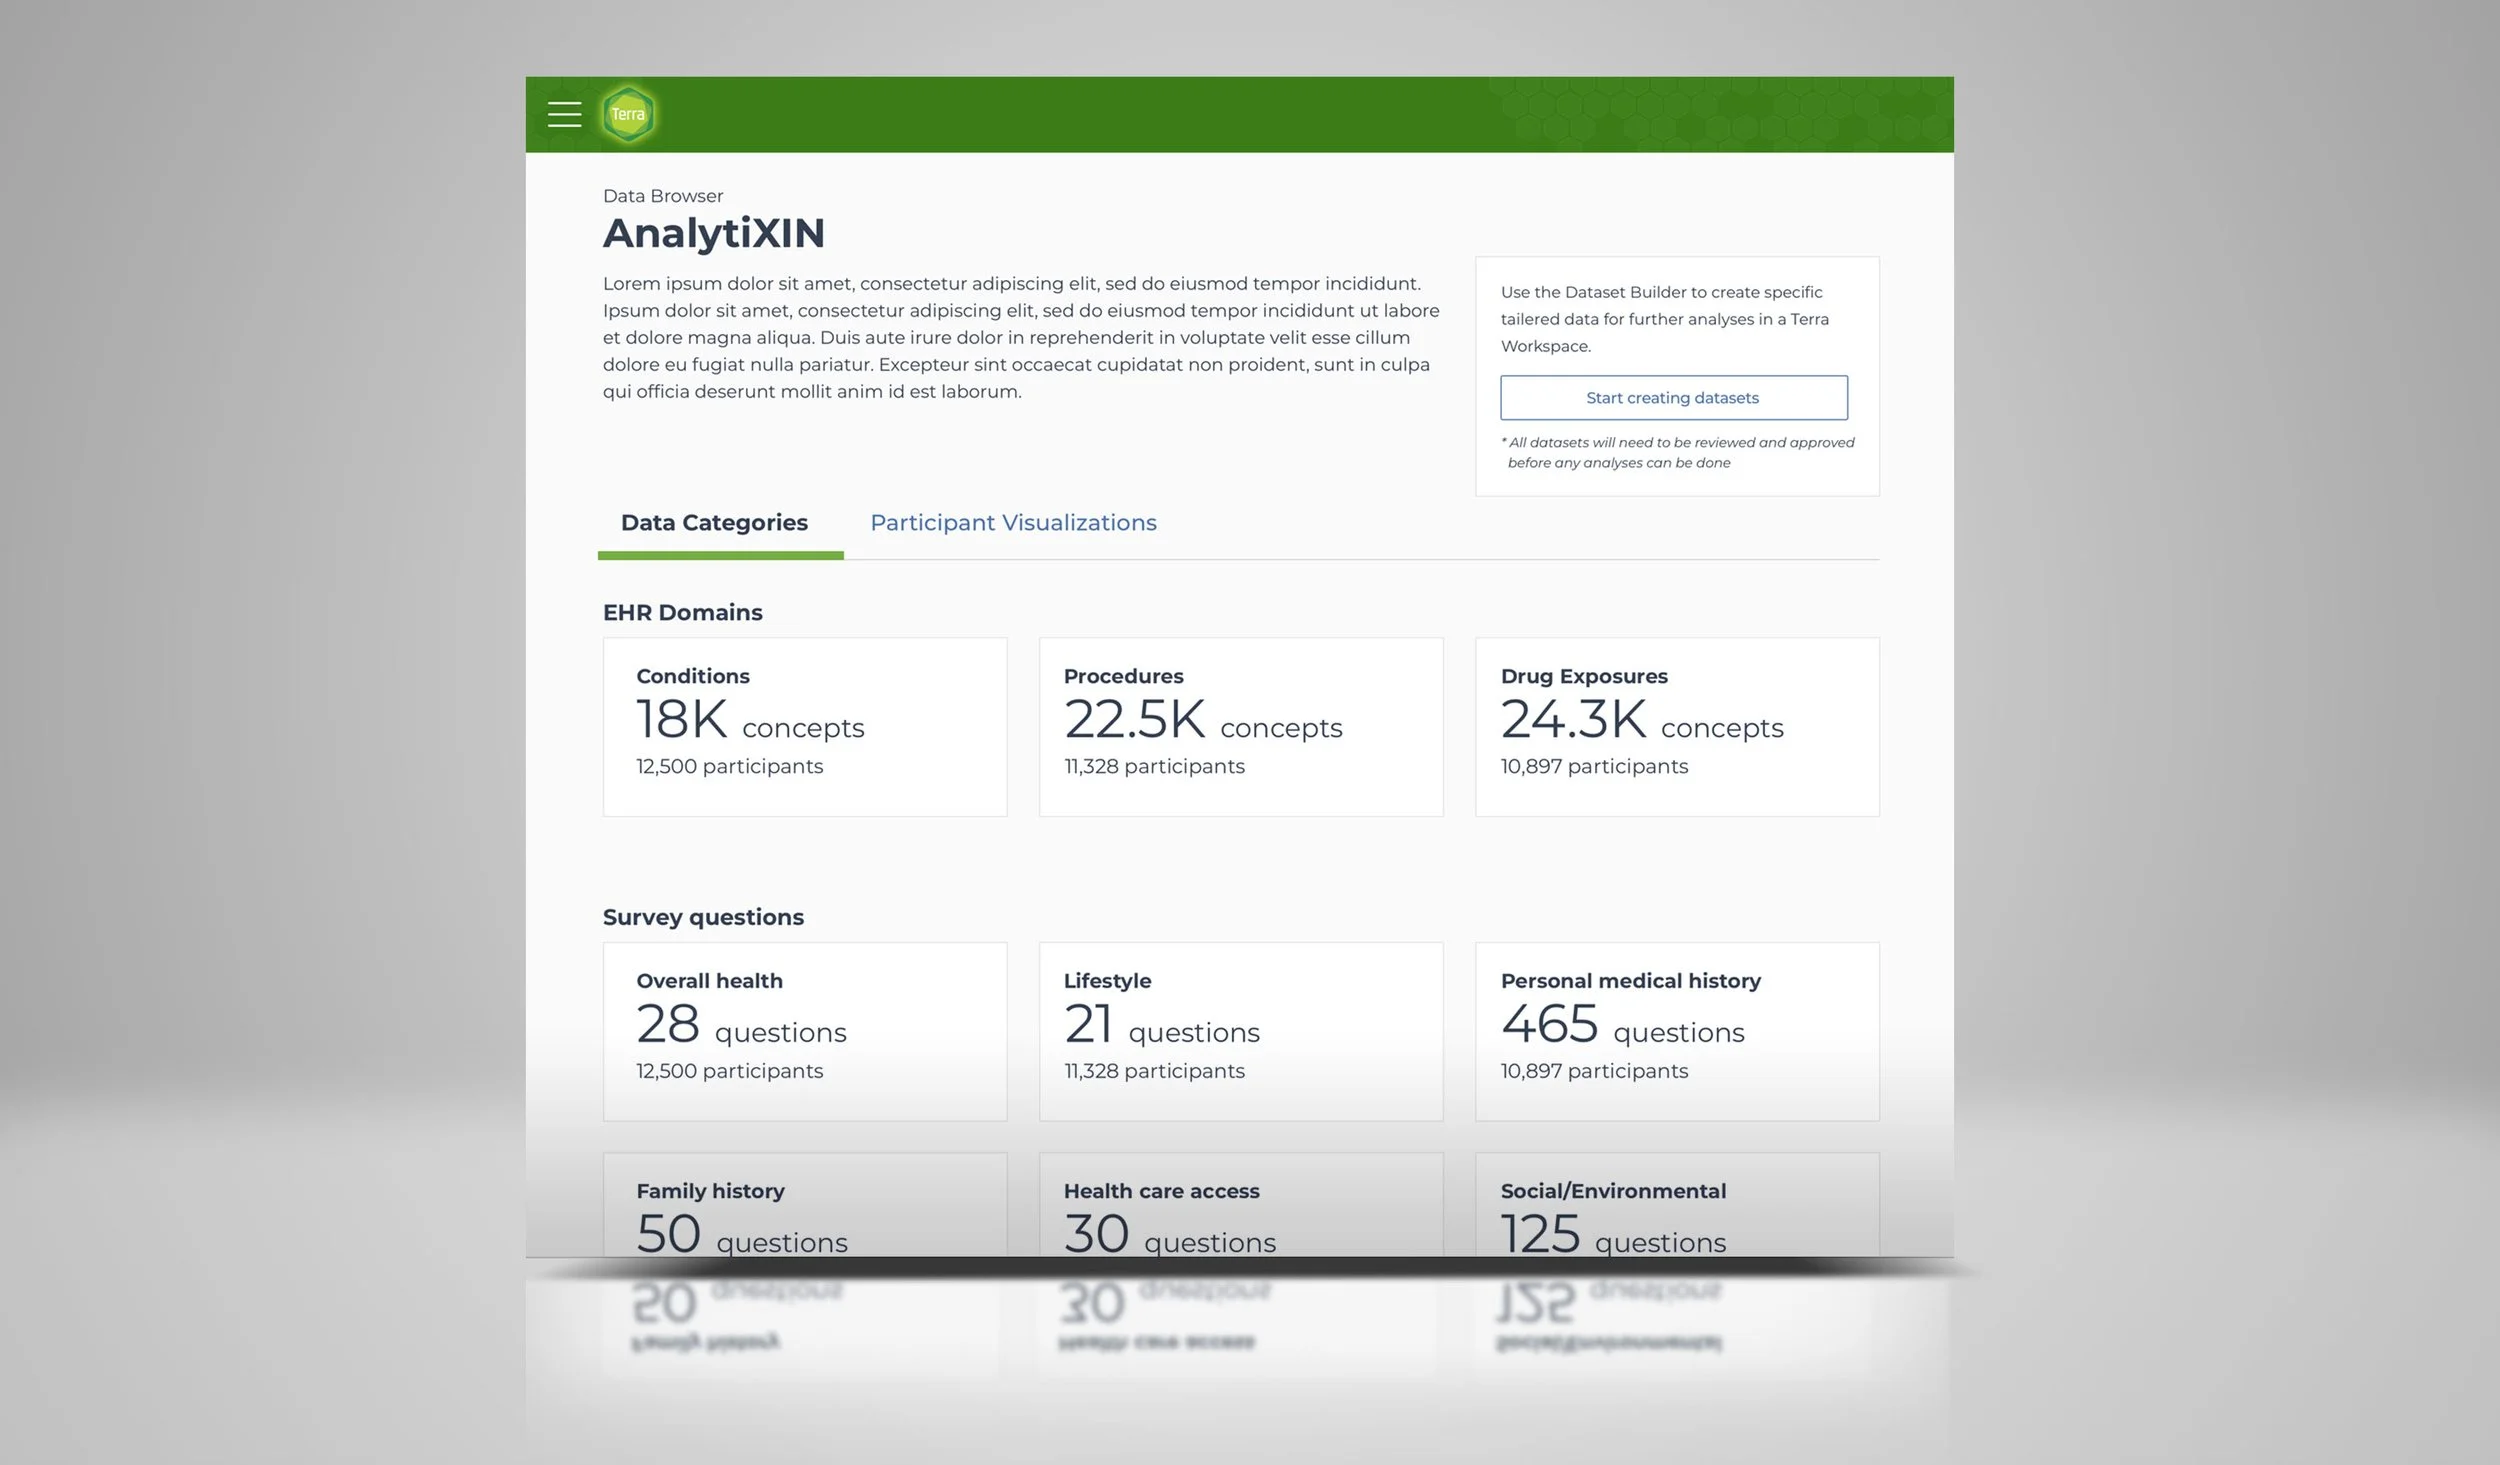
Dataset included categories
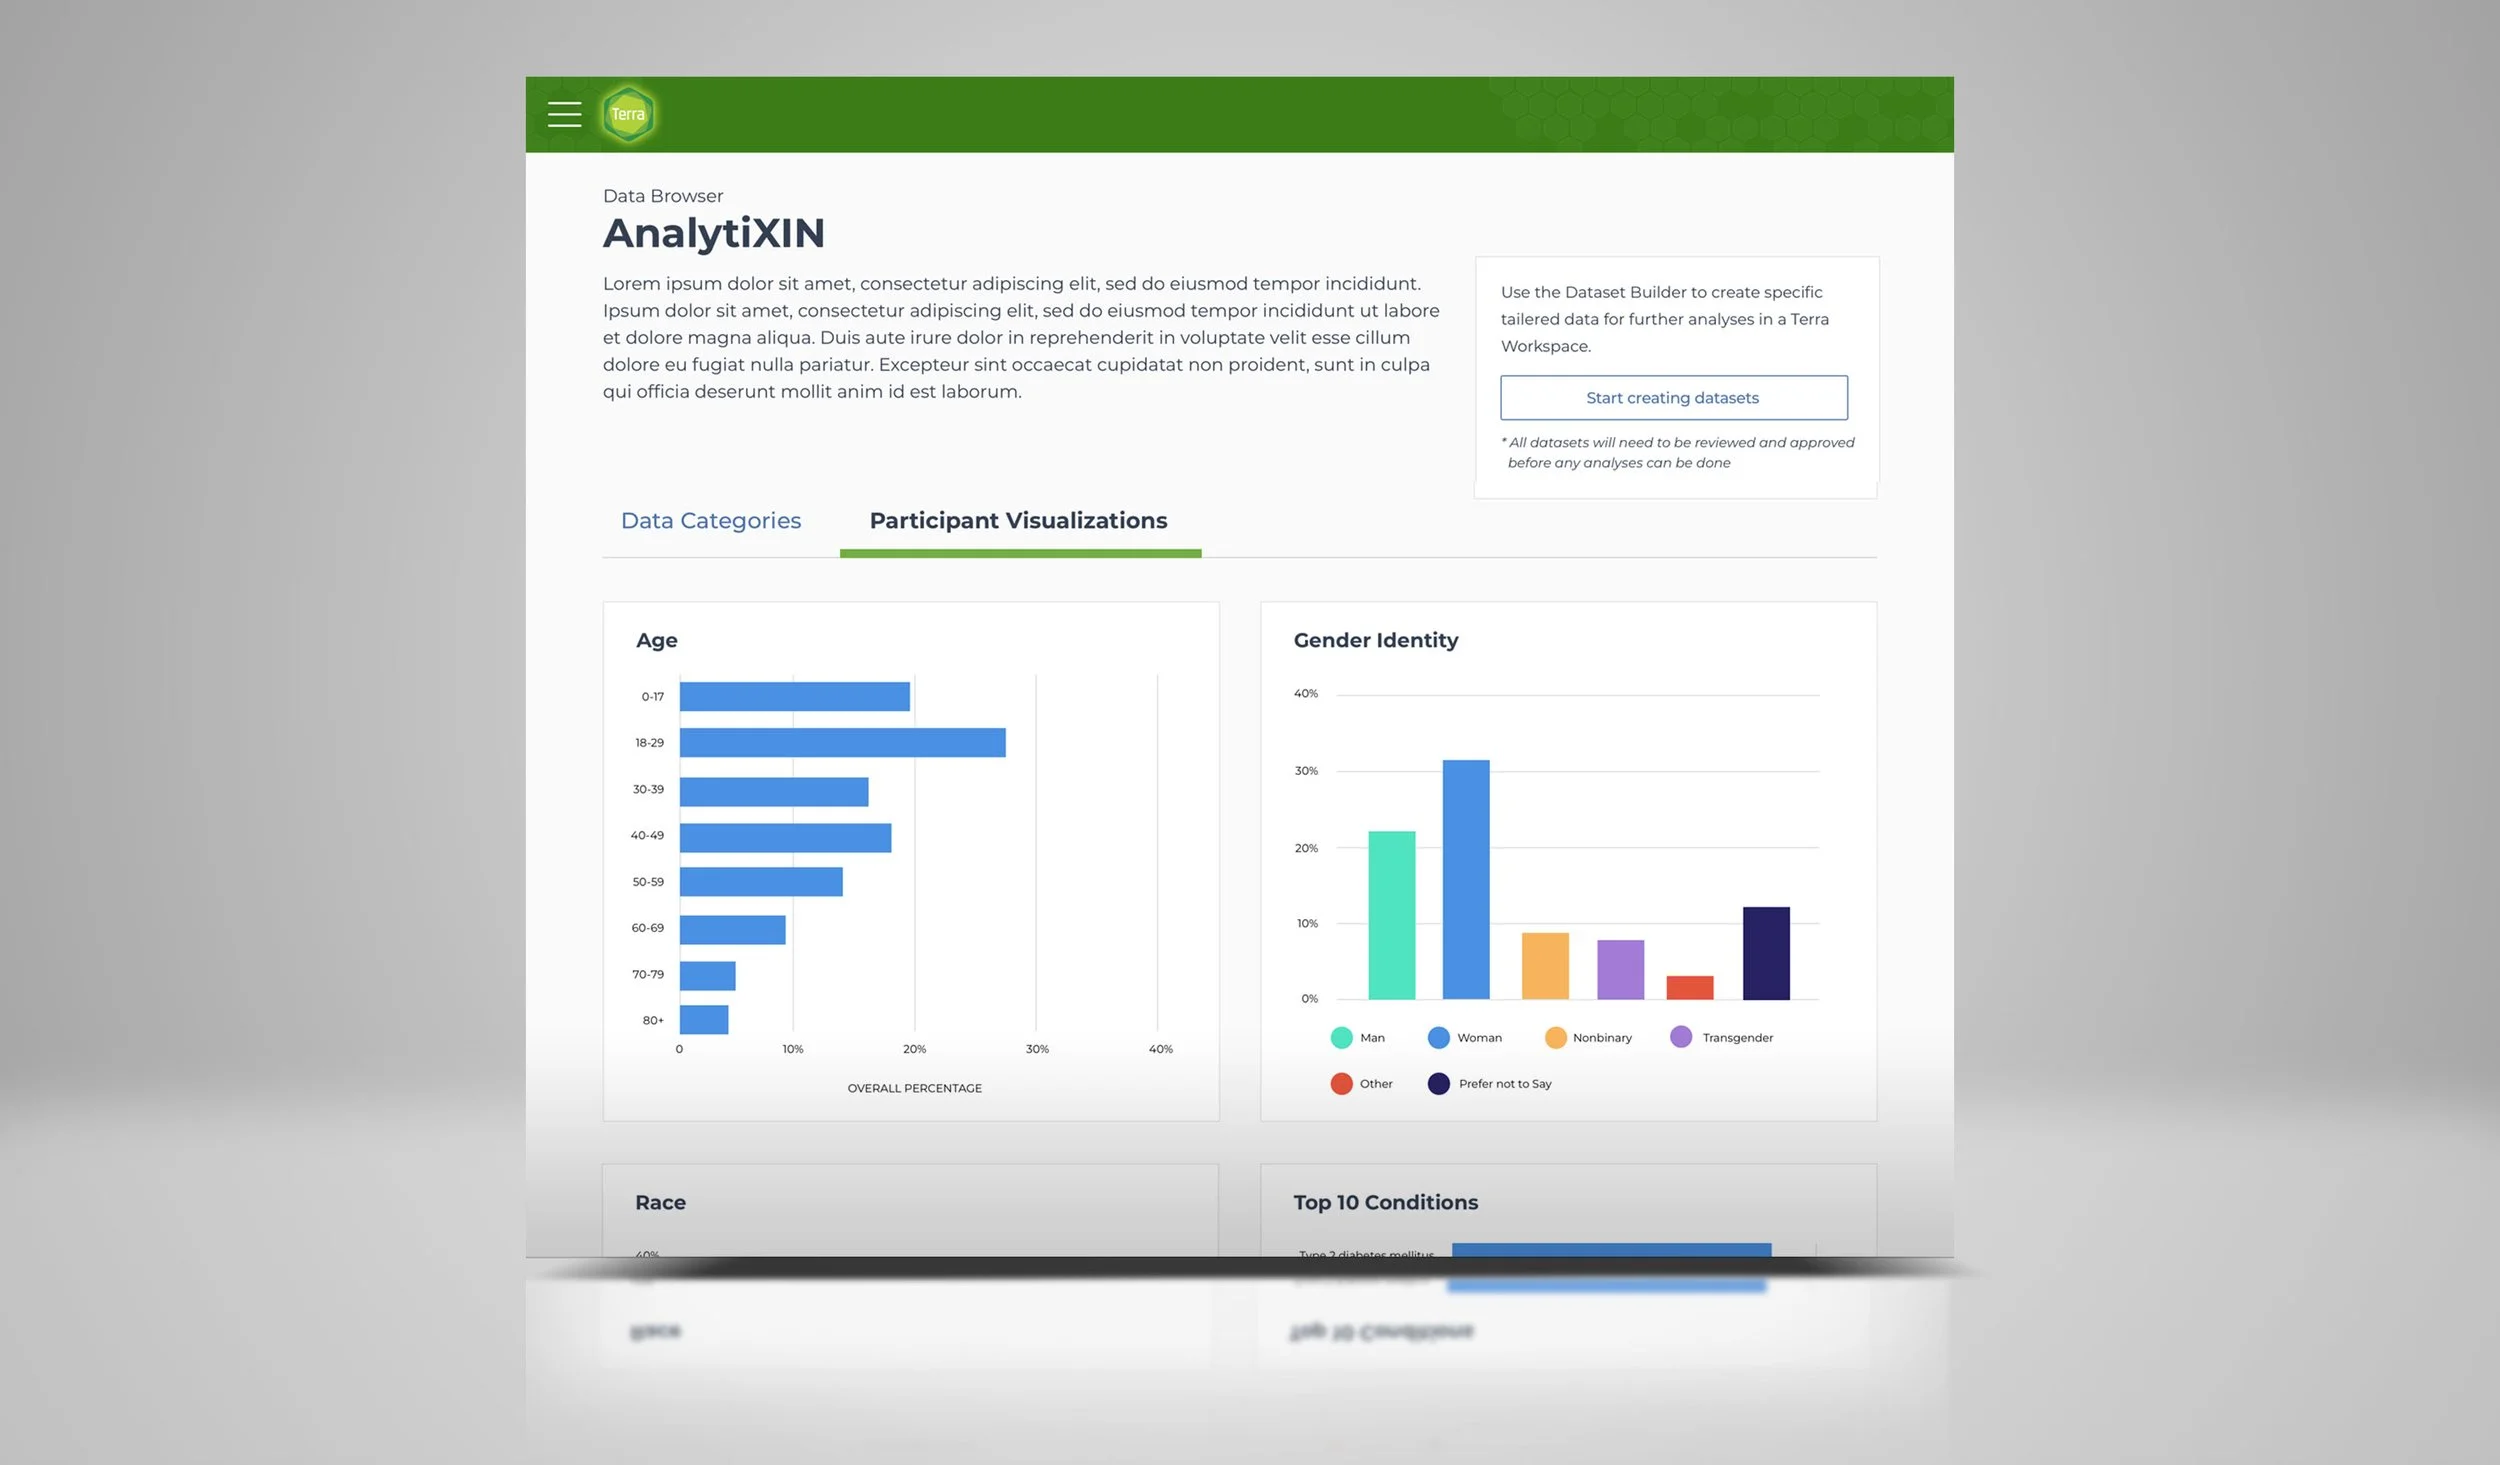
Dataset demographic info
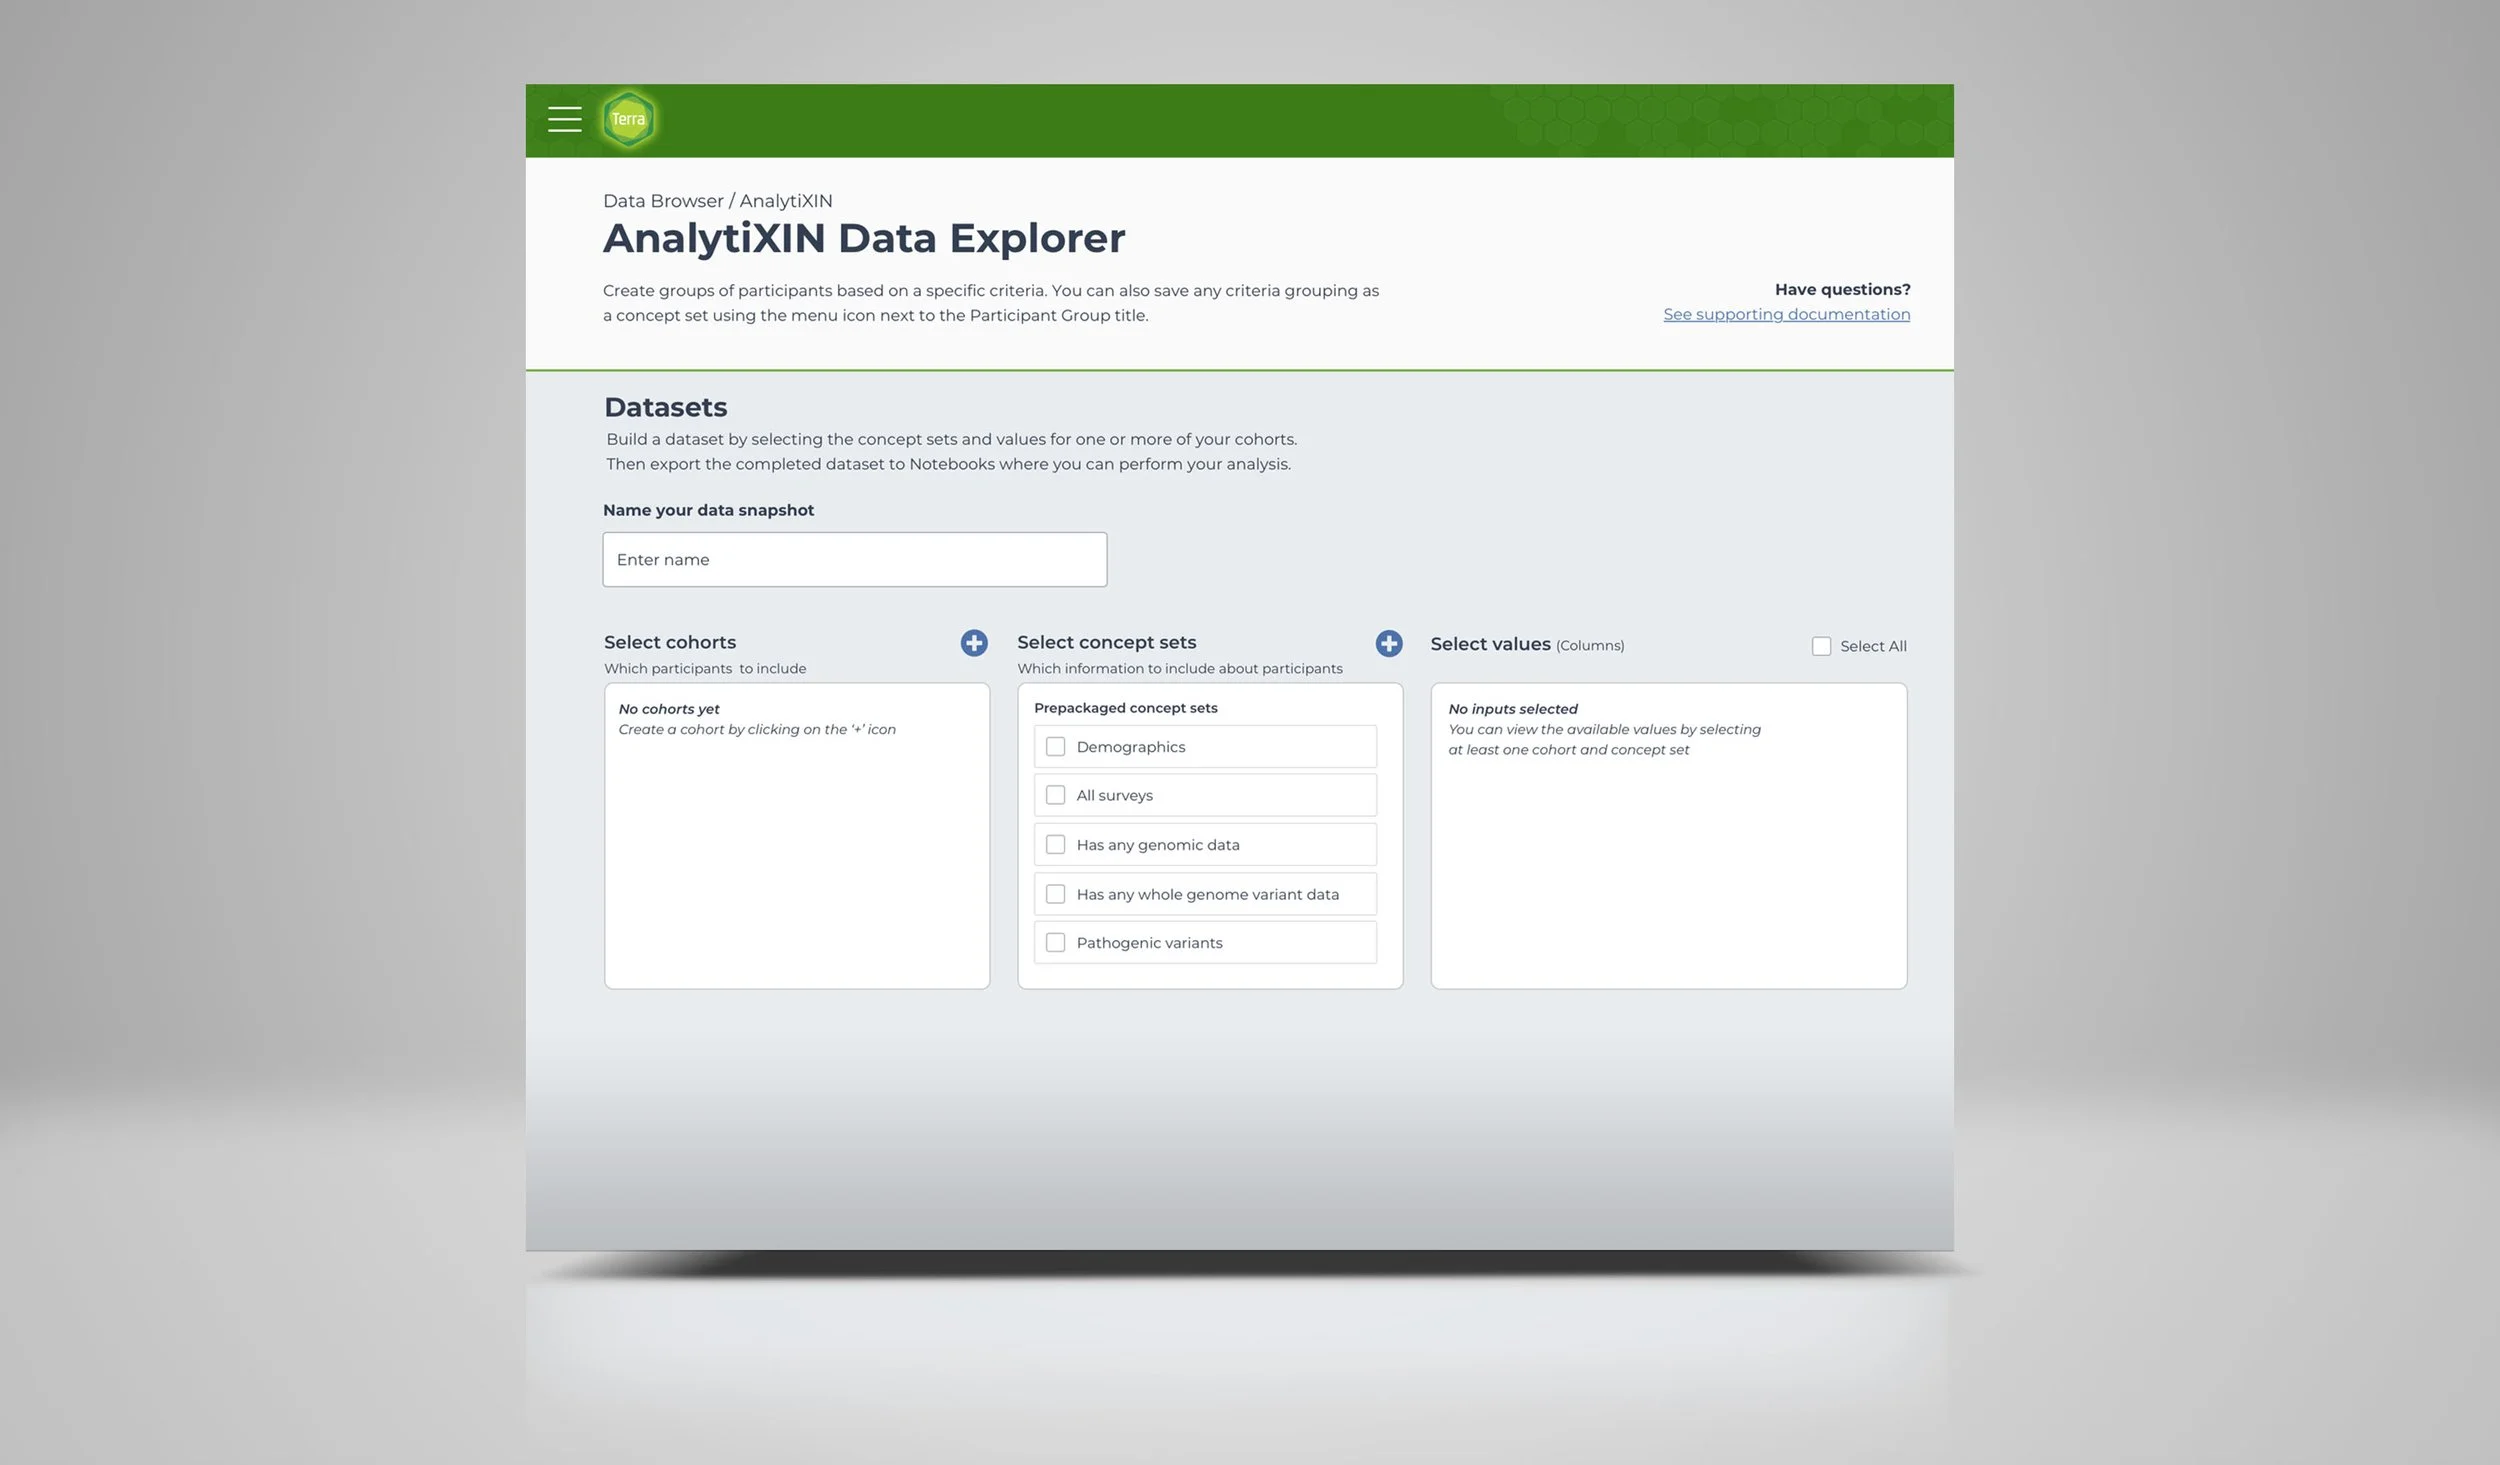
Cohort creation screen
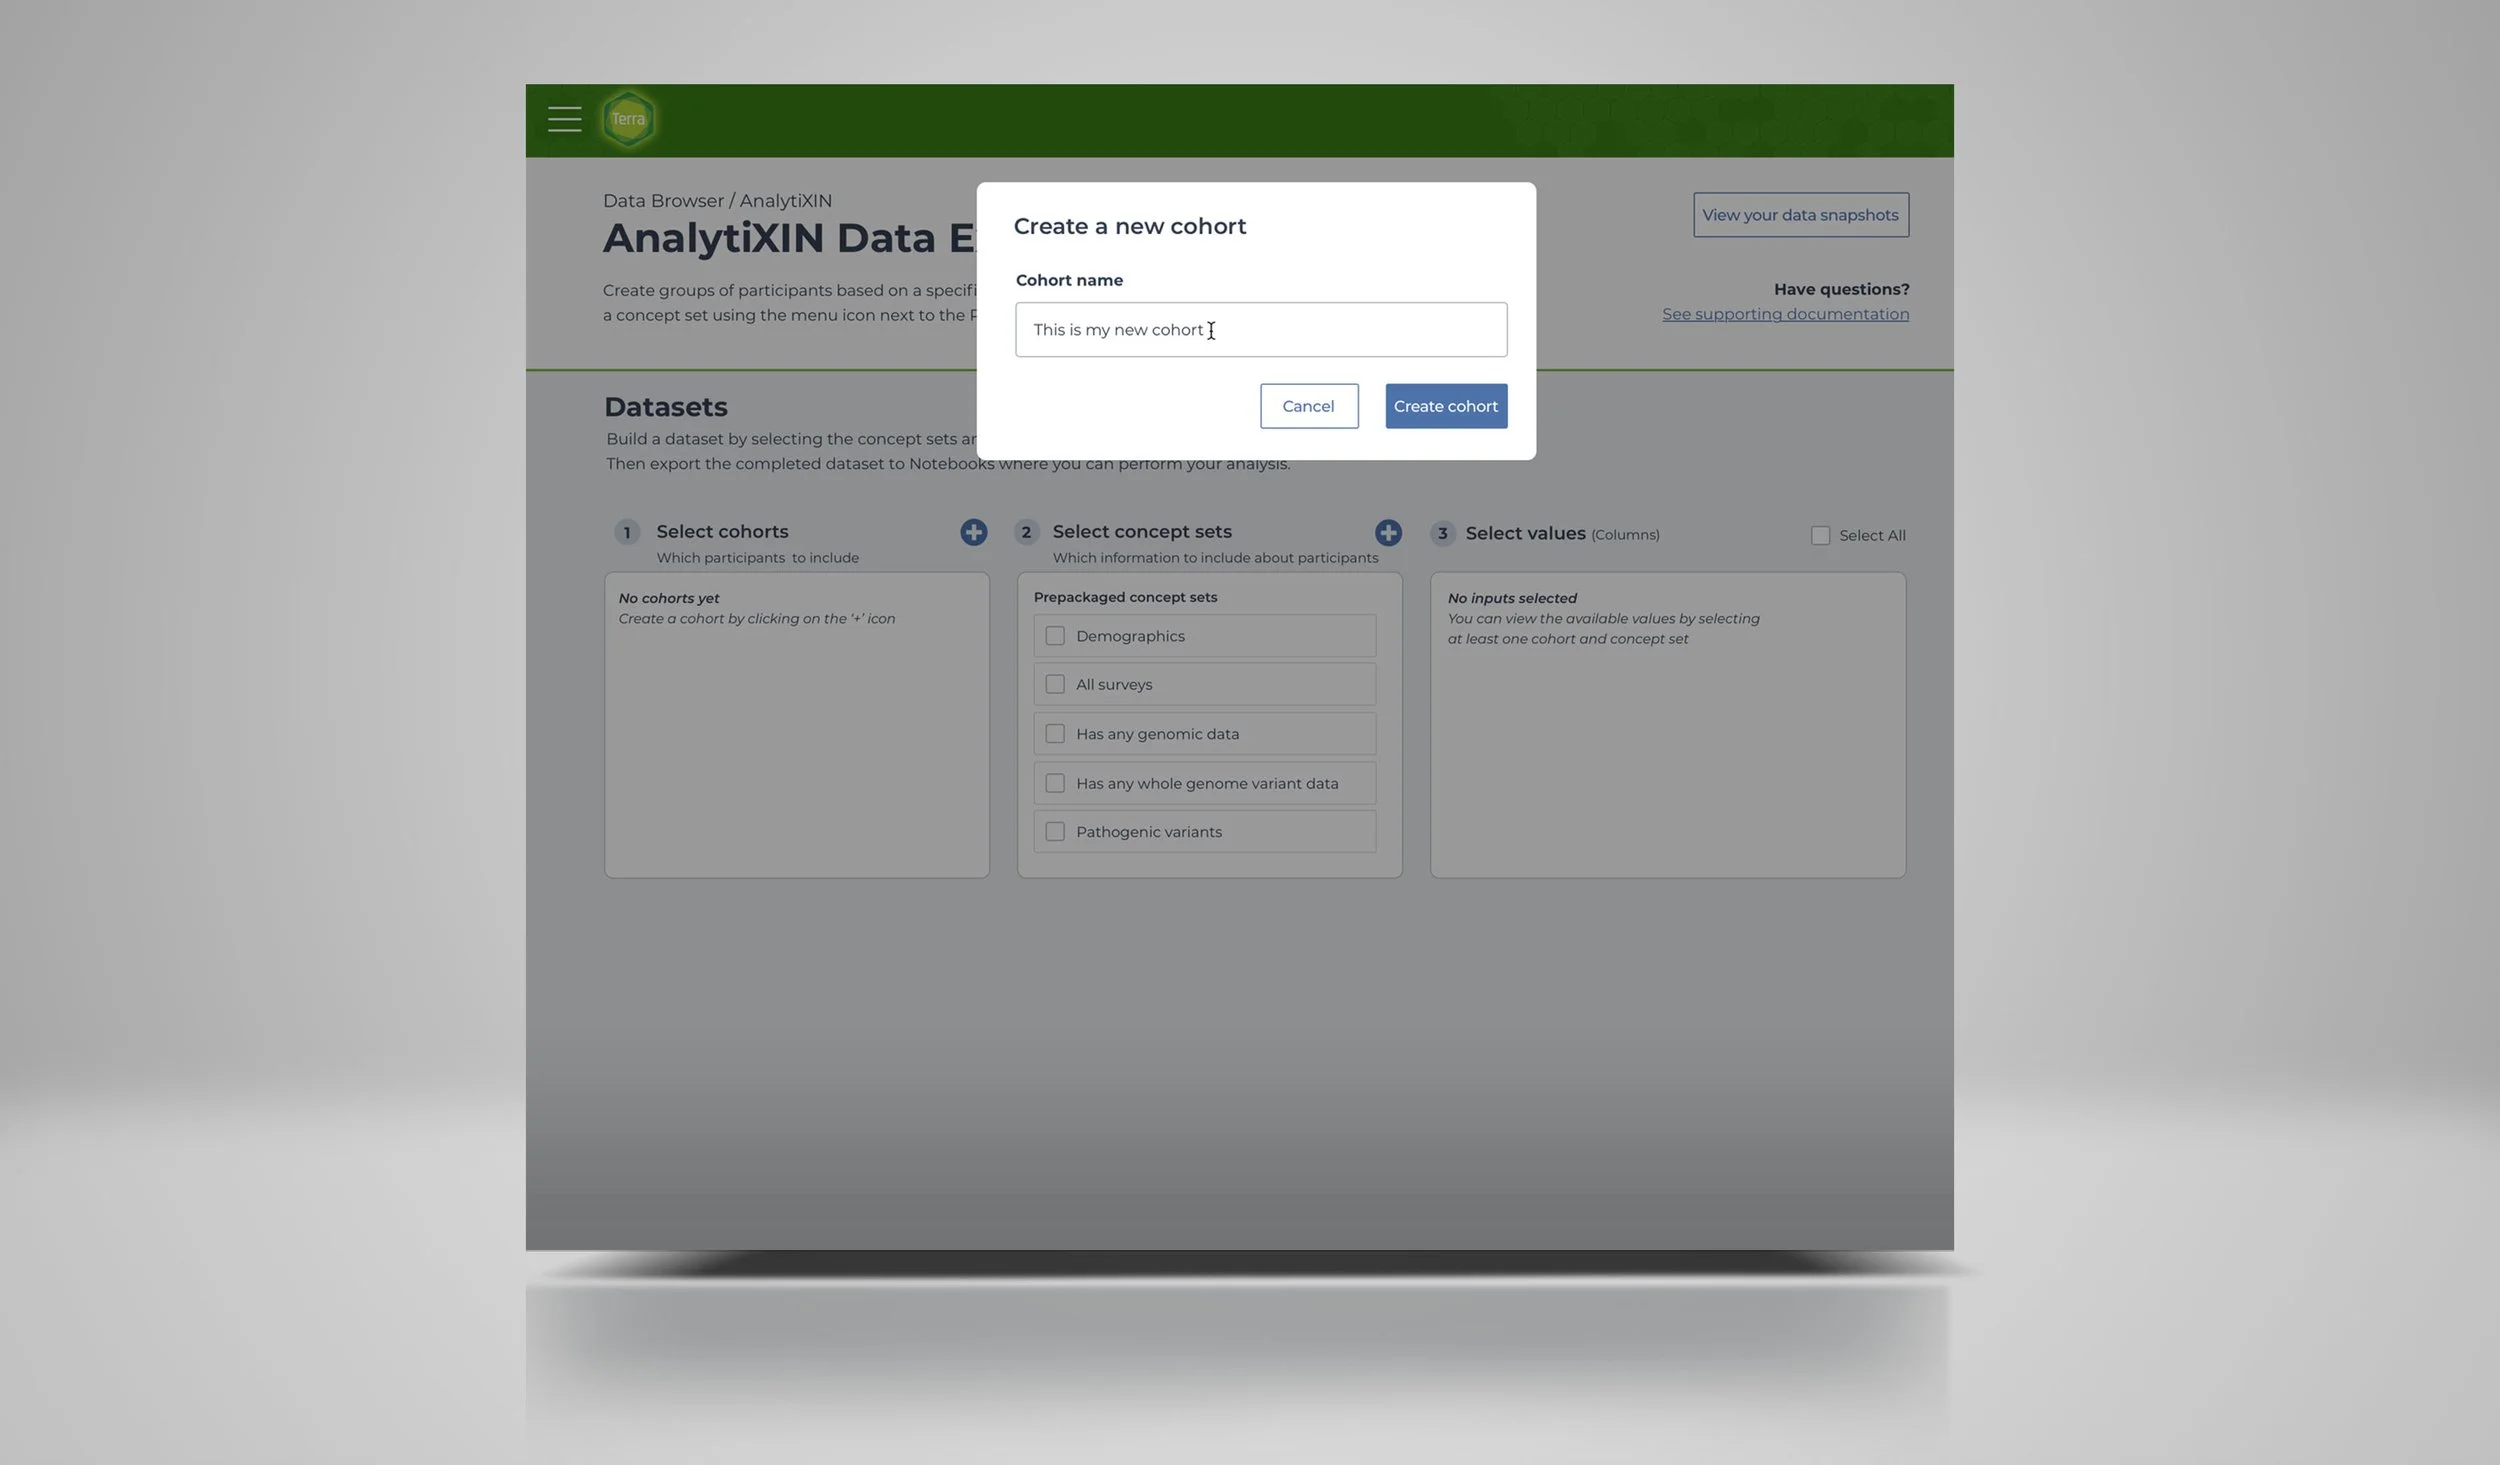
Naming cohort
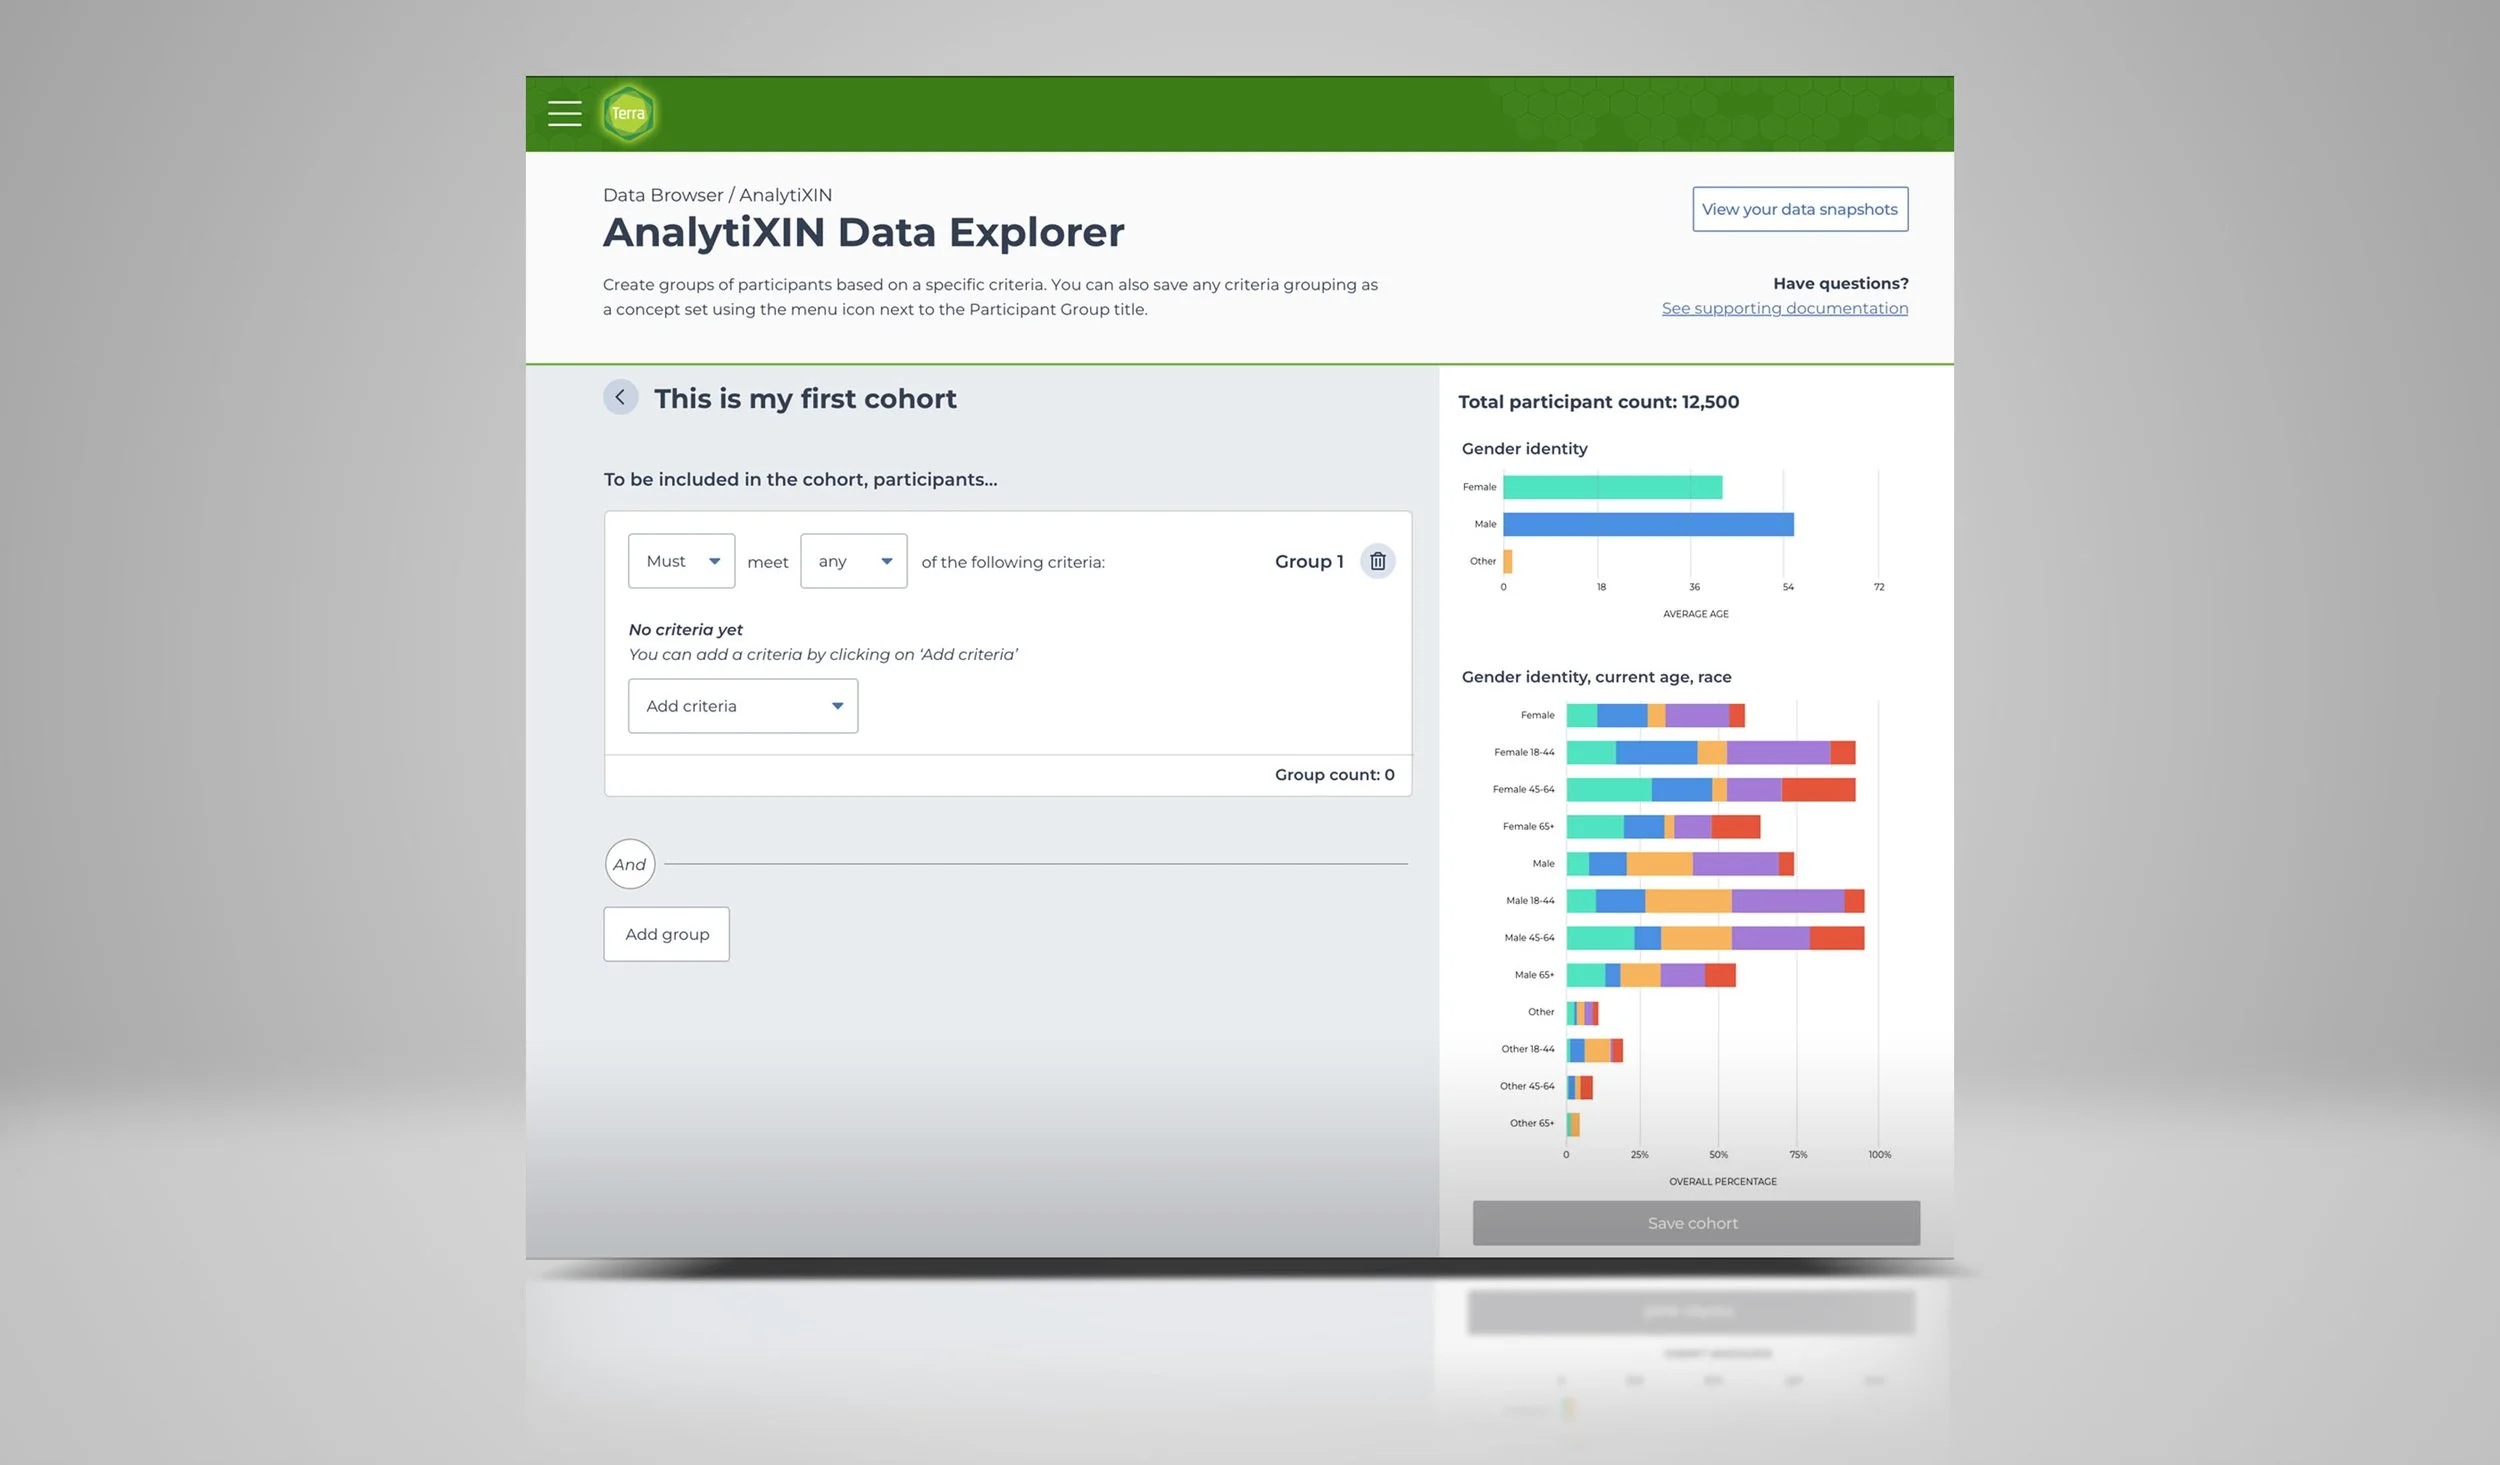
Criteria selection with preview demographic charts
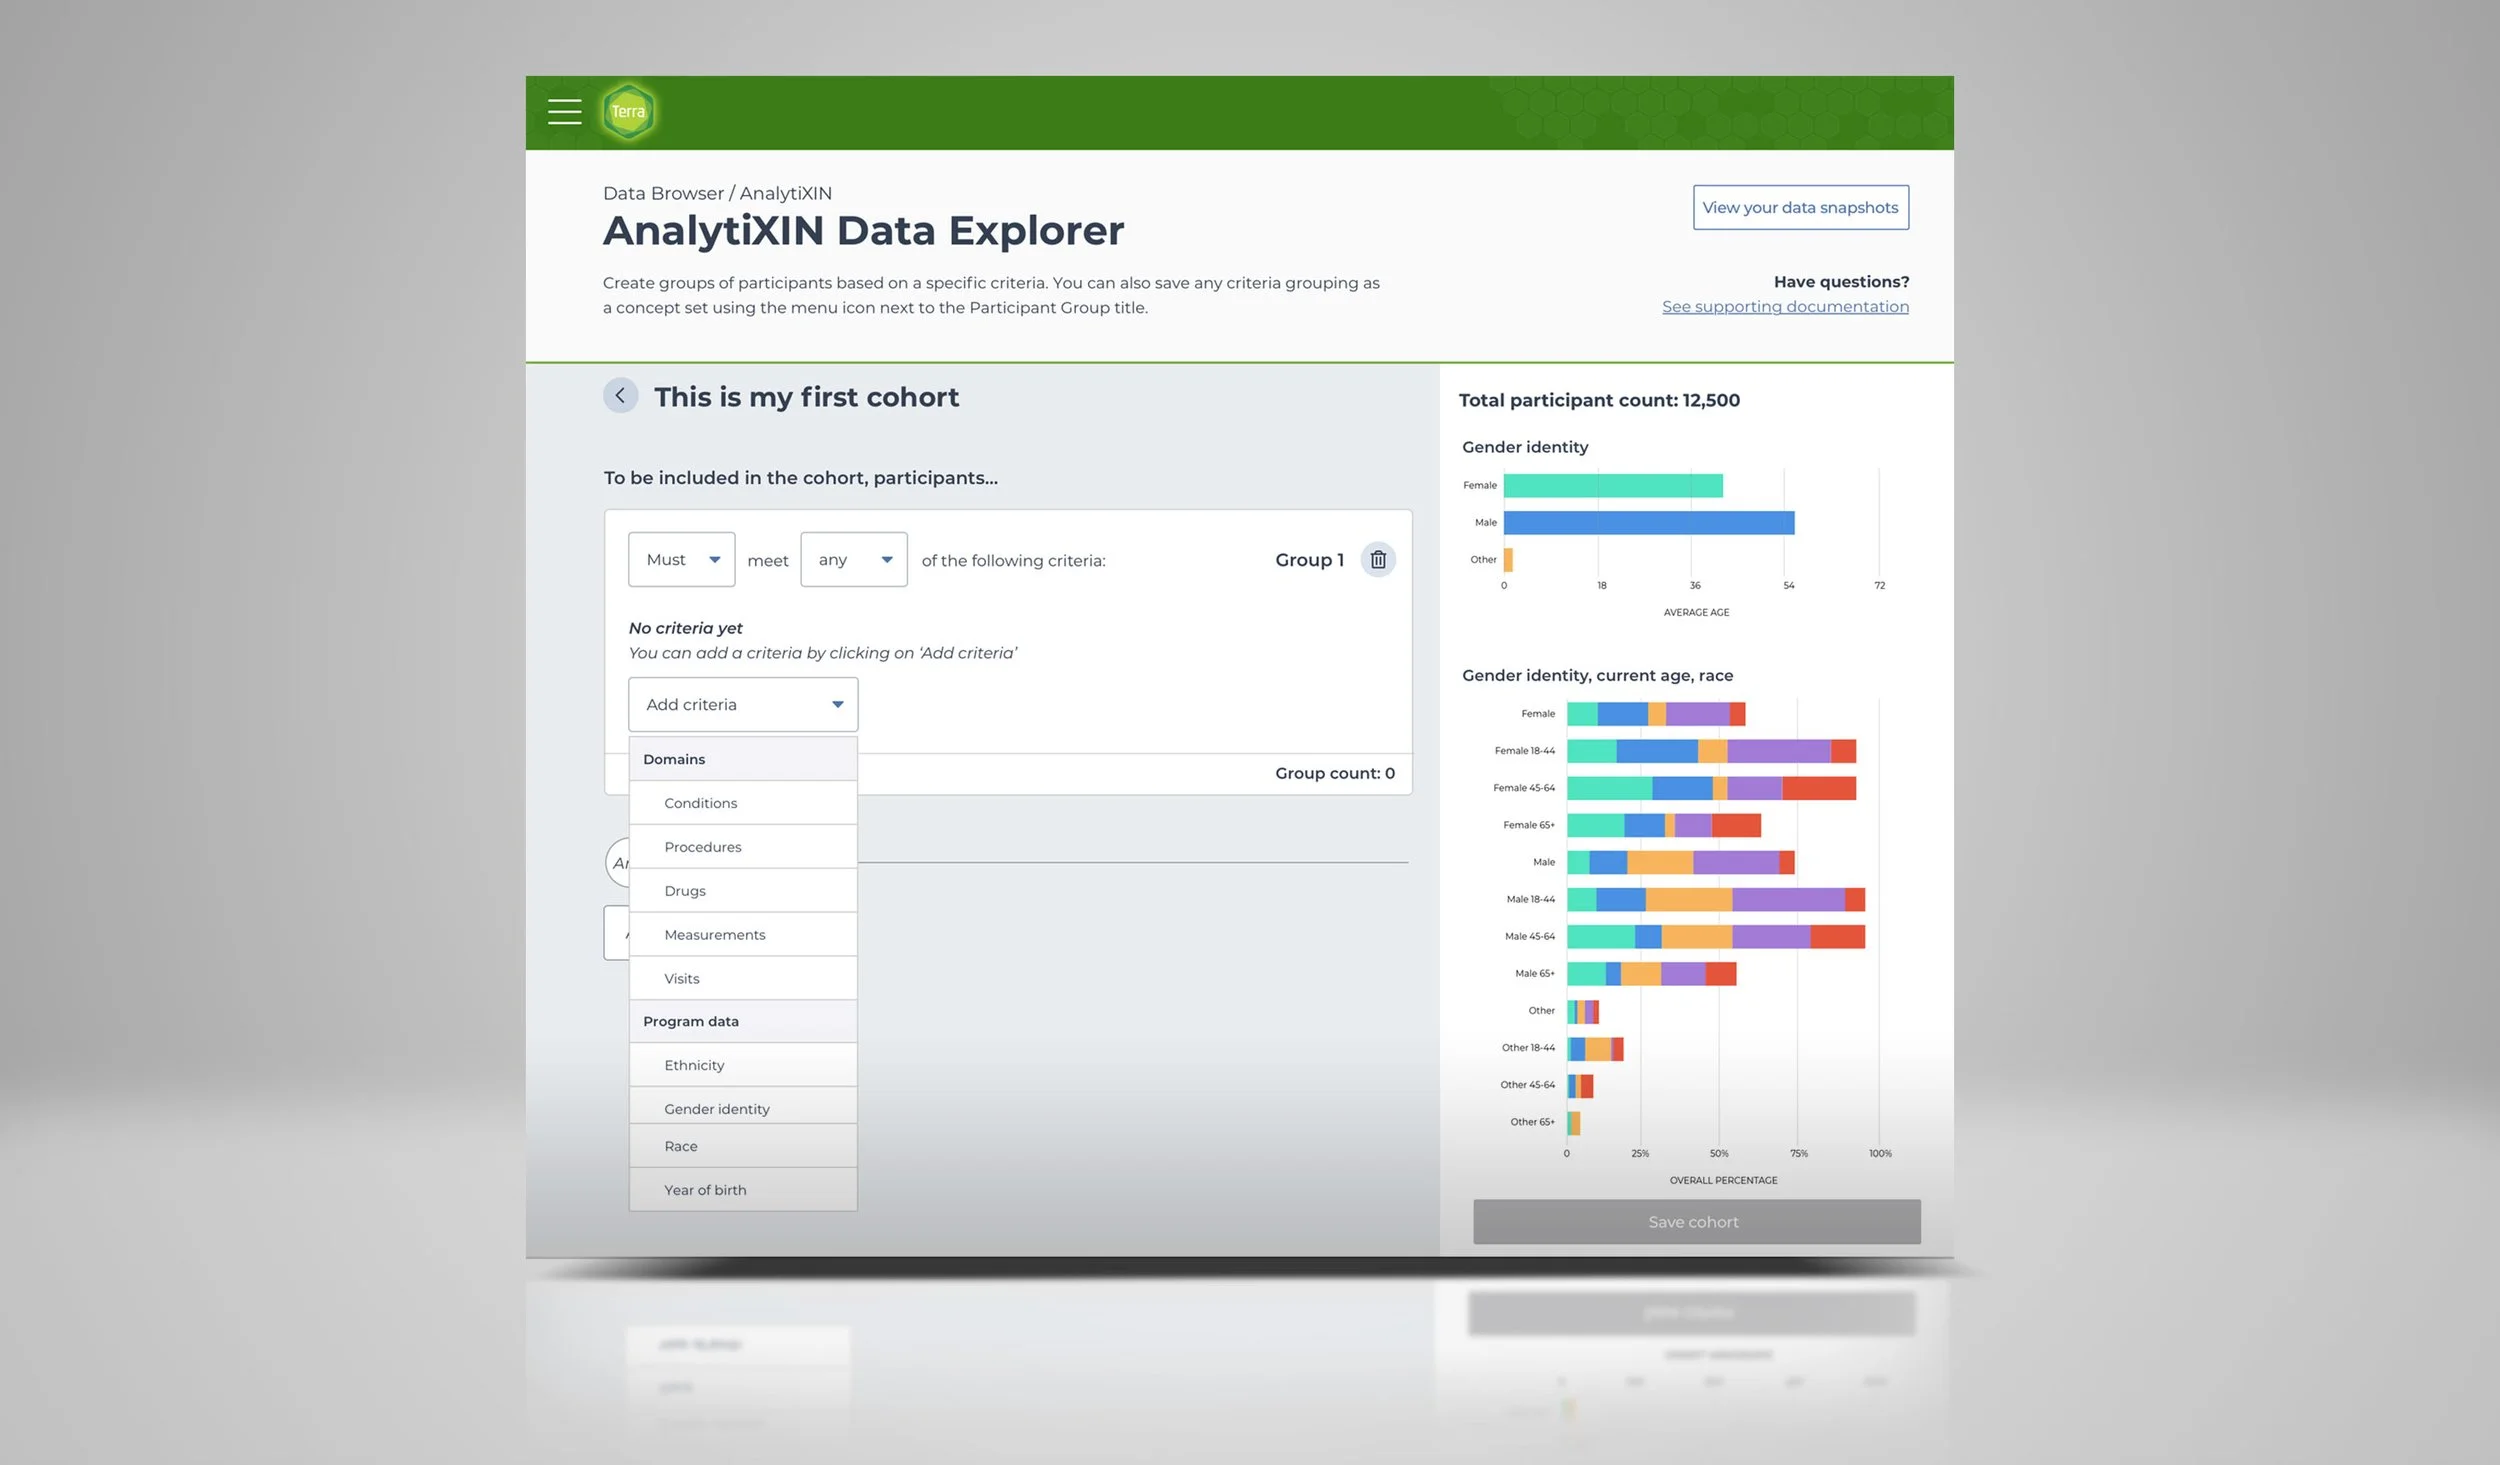
Criteria selection dropdown
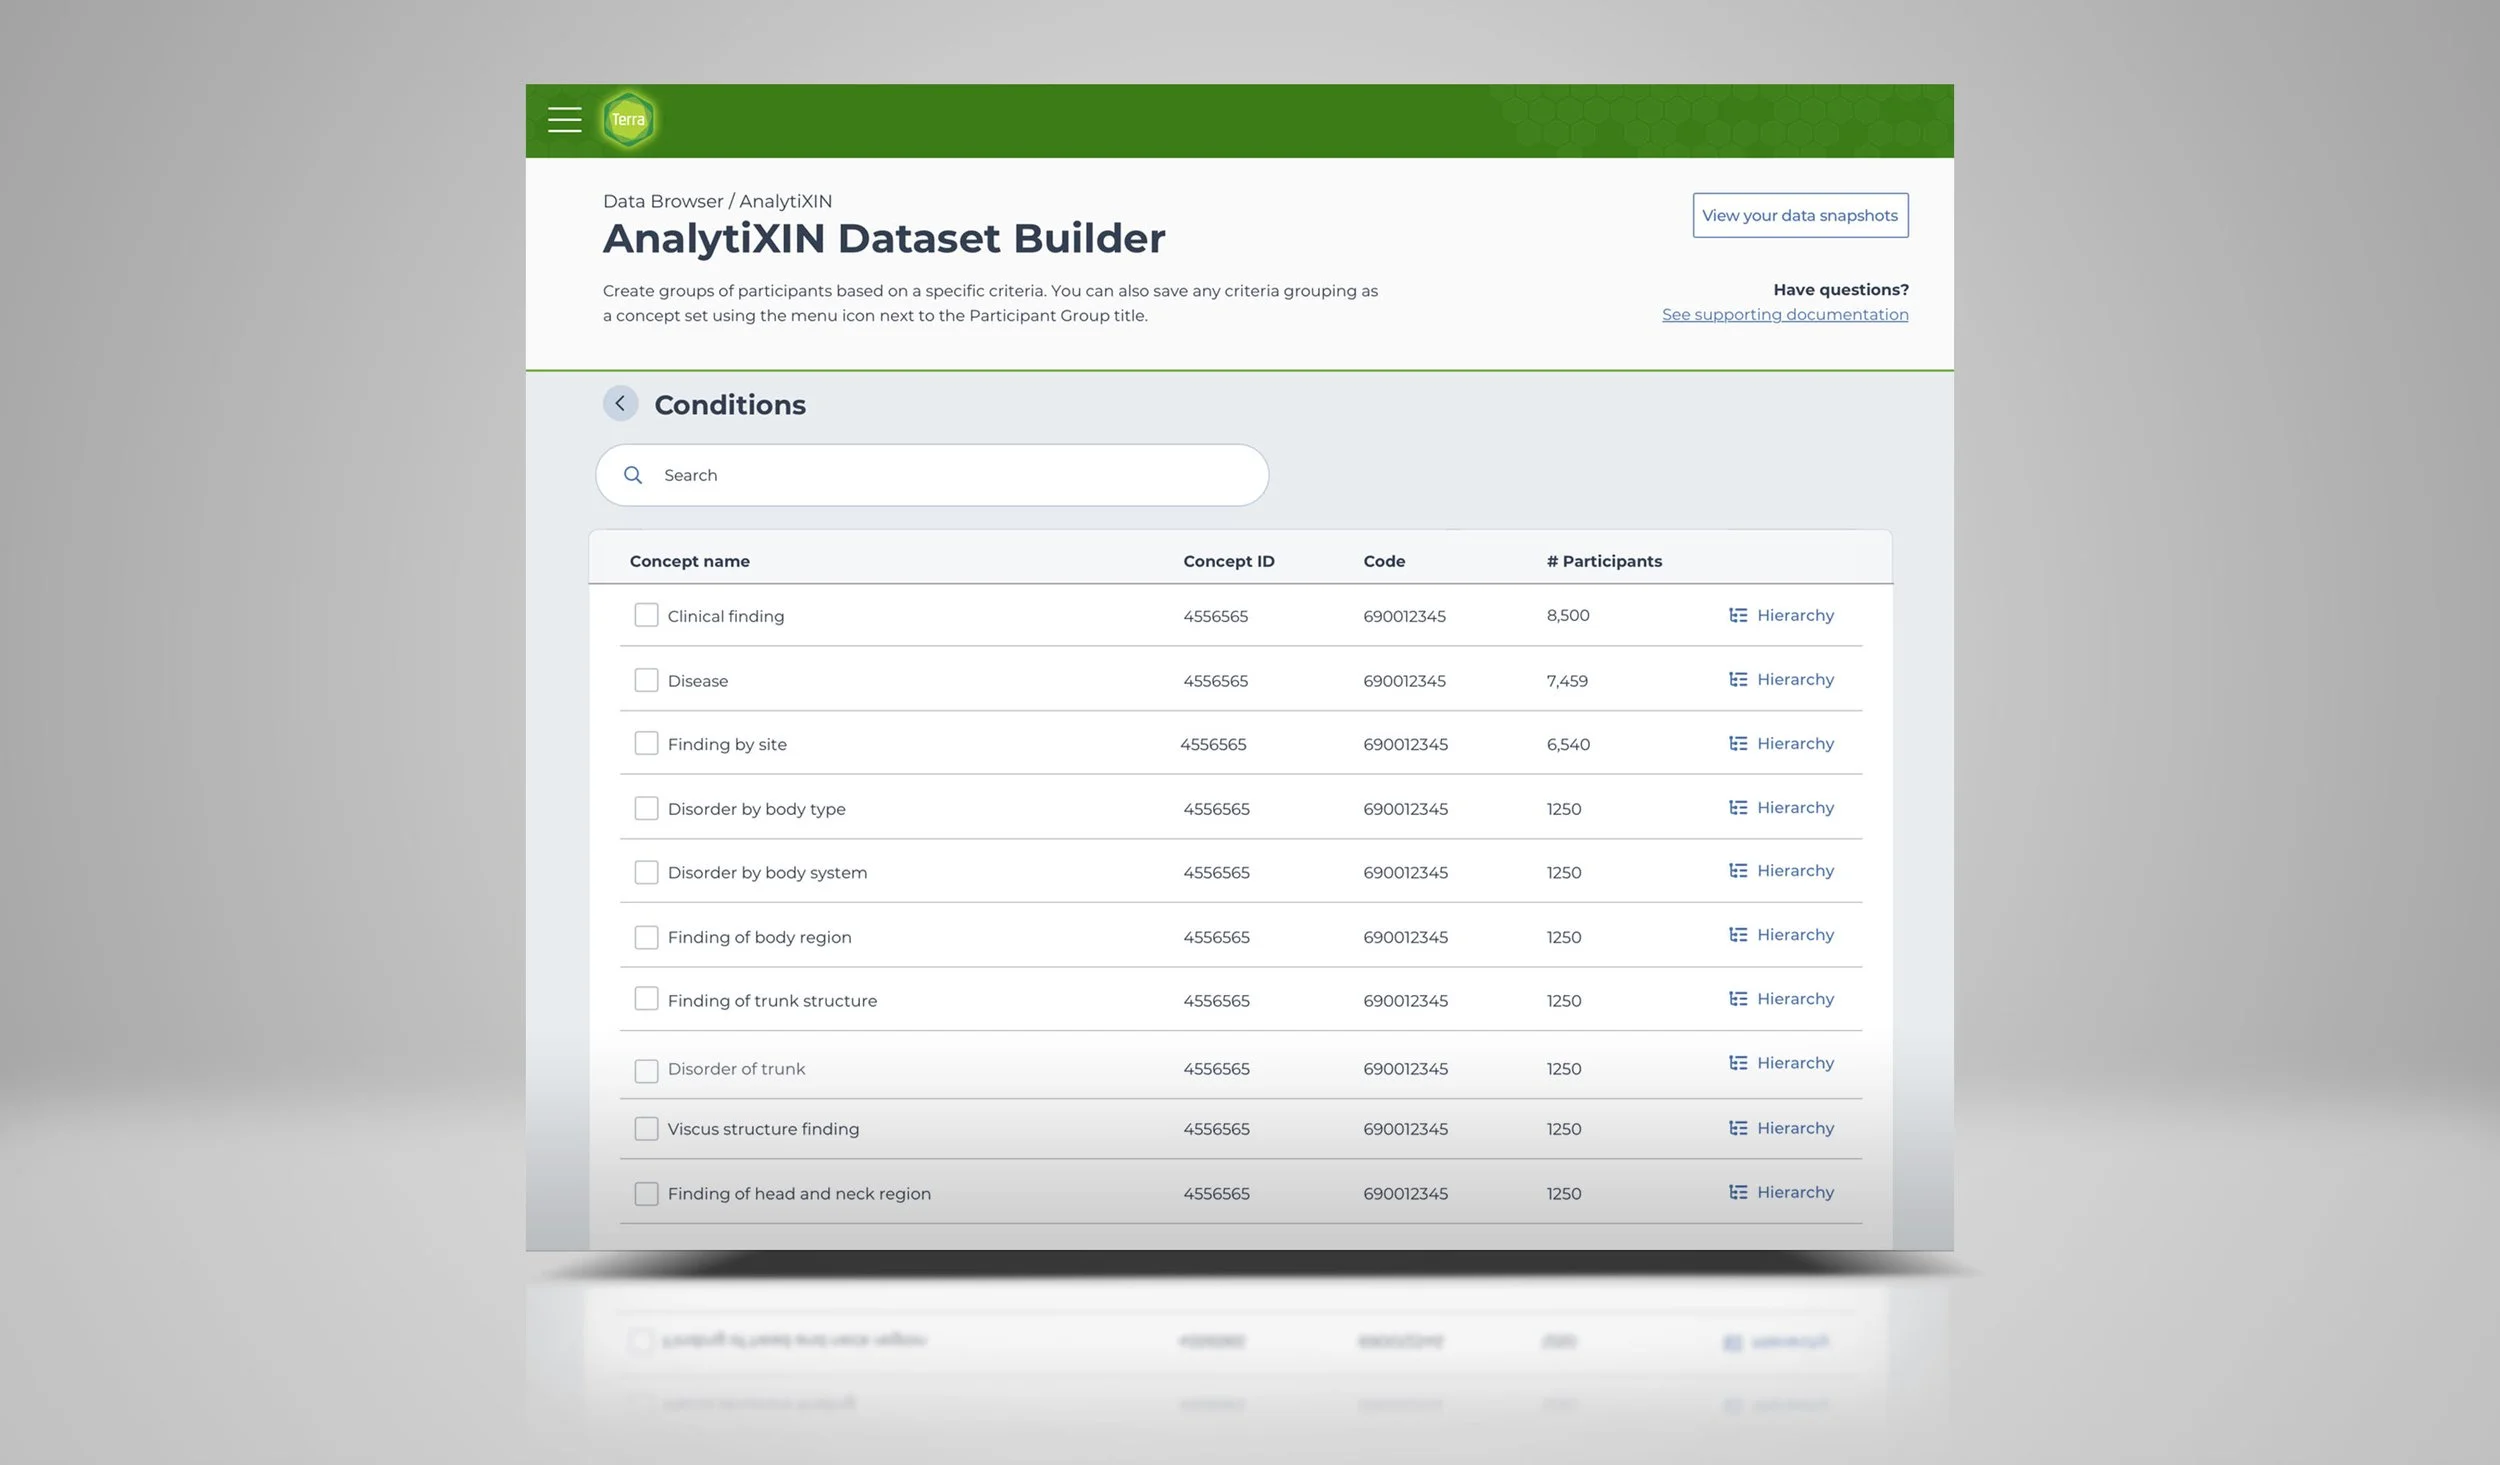
Condition data table
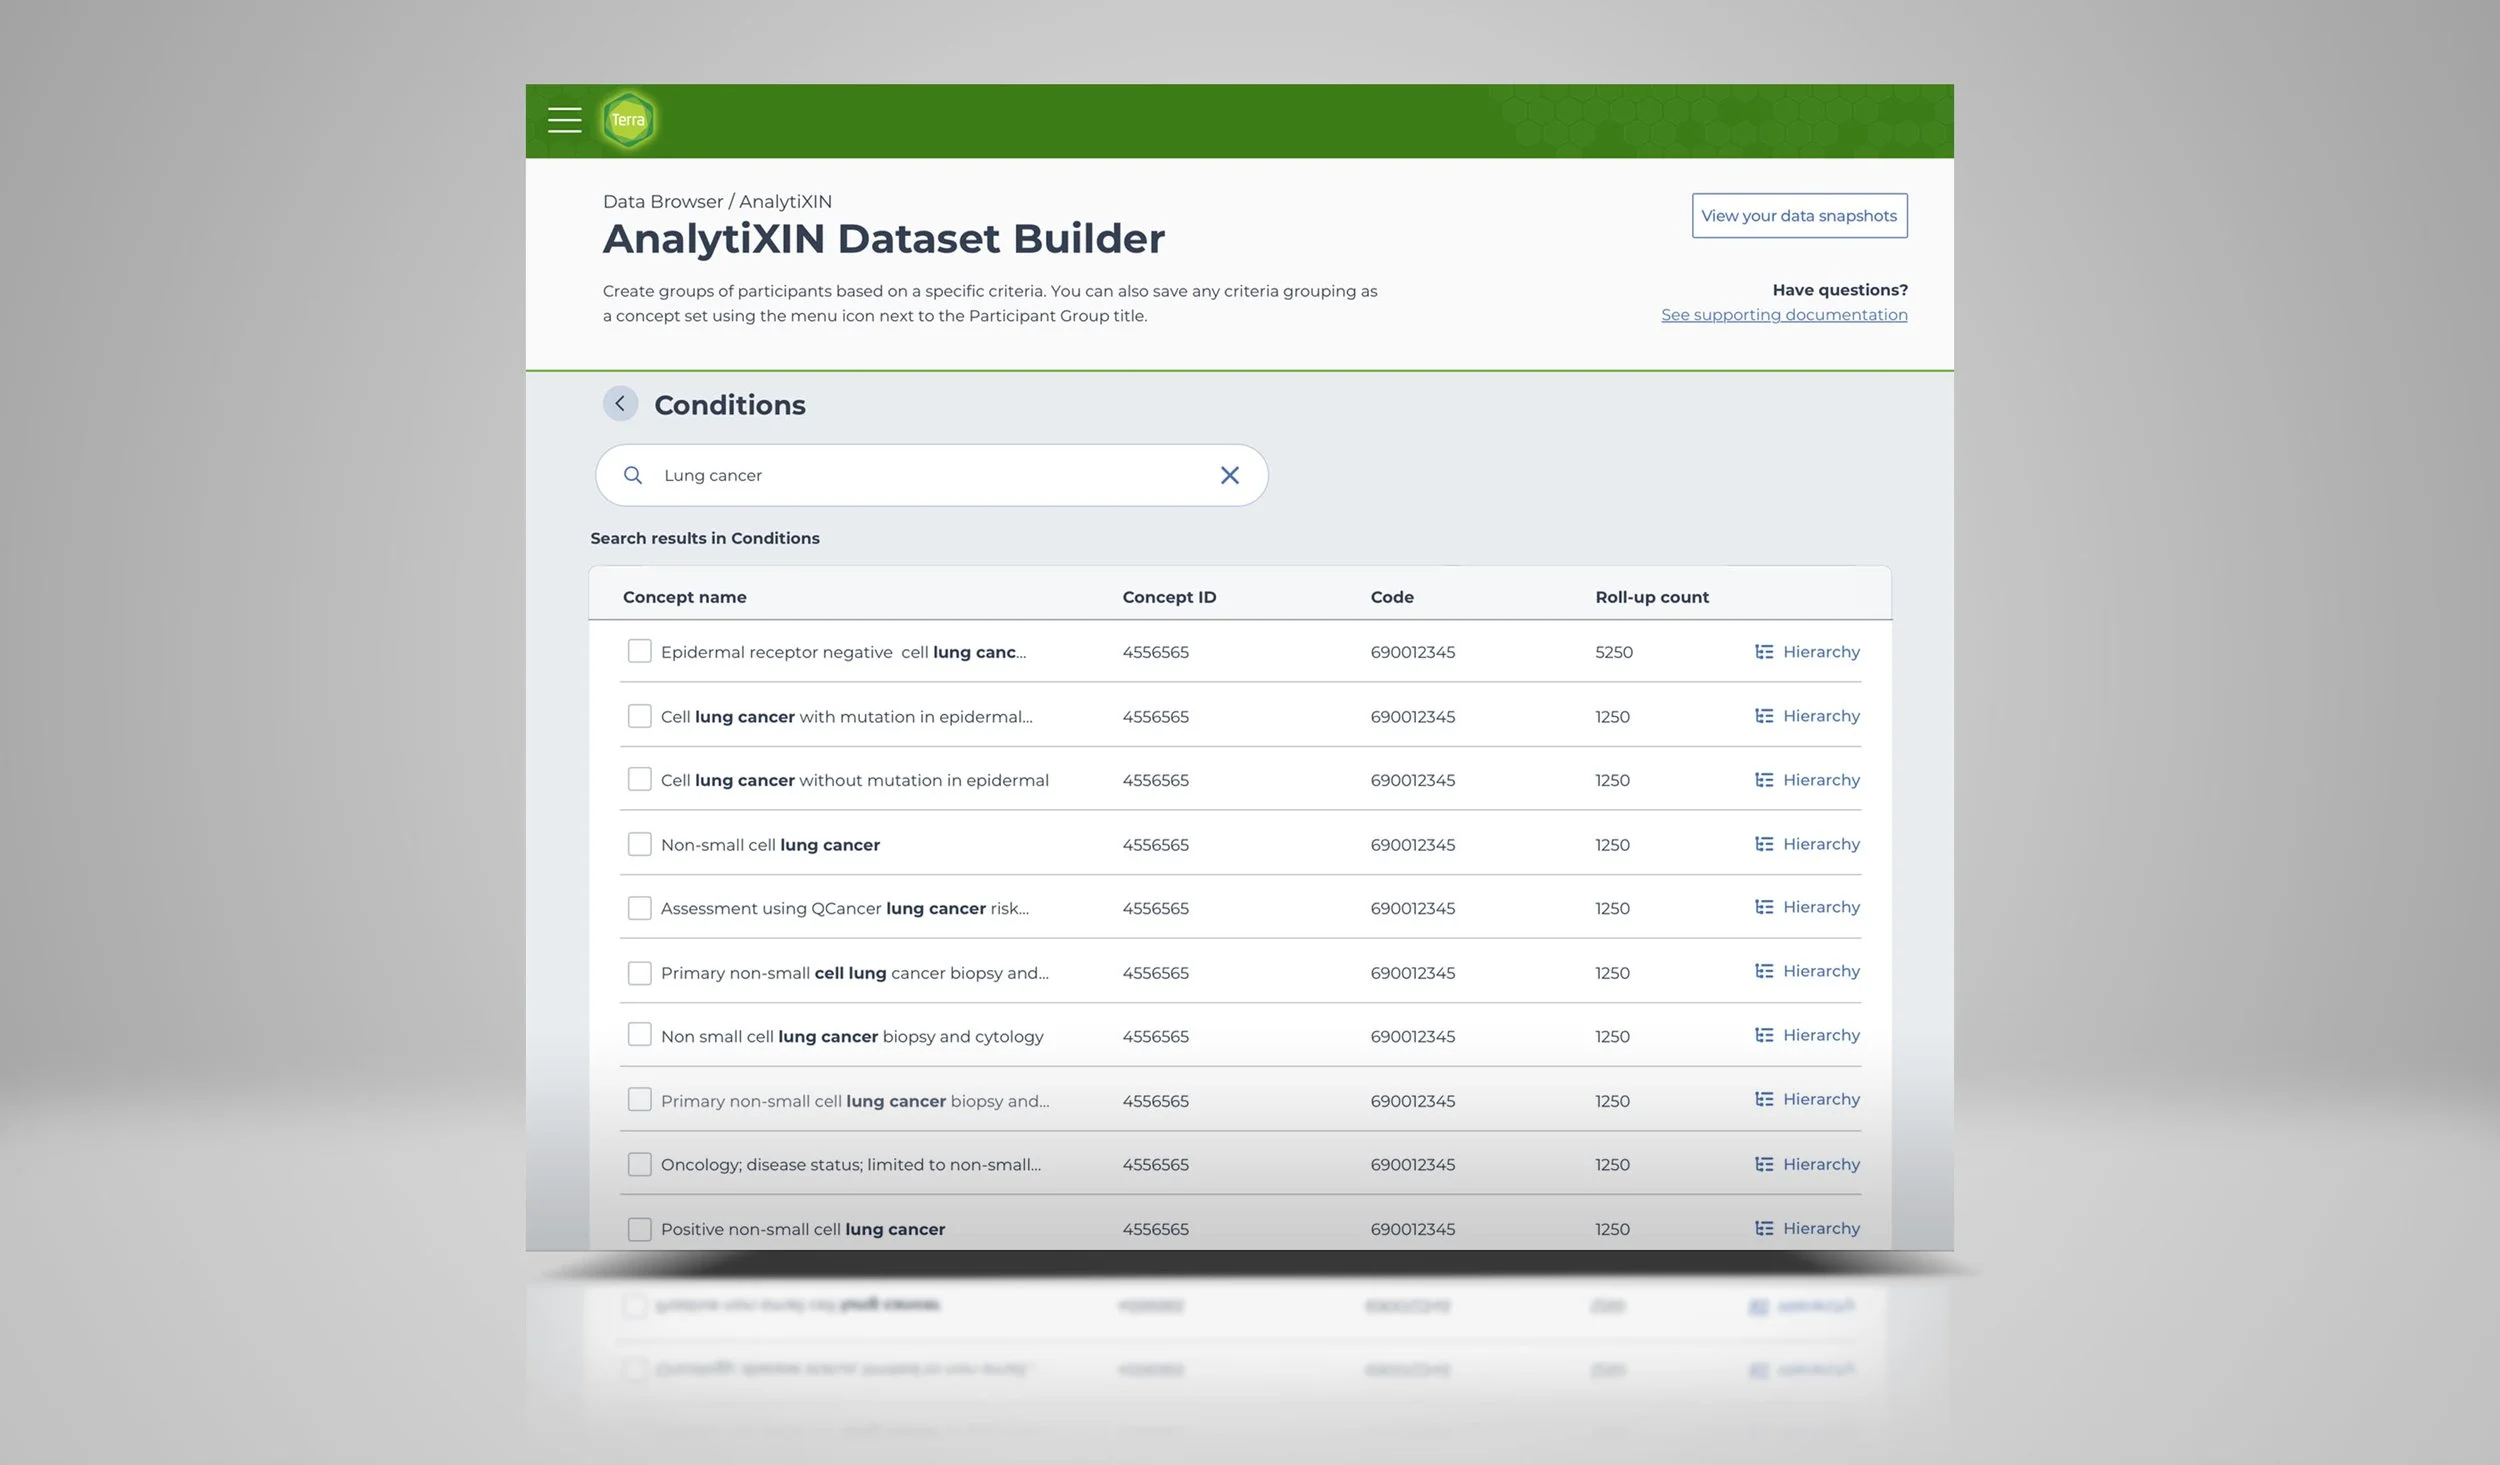
Searching in conditions data table
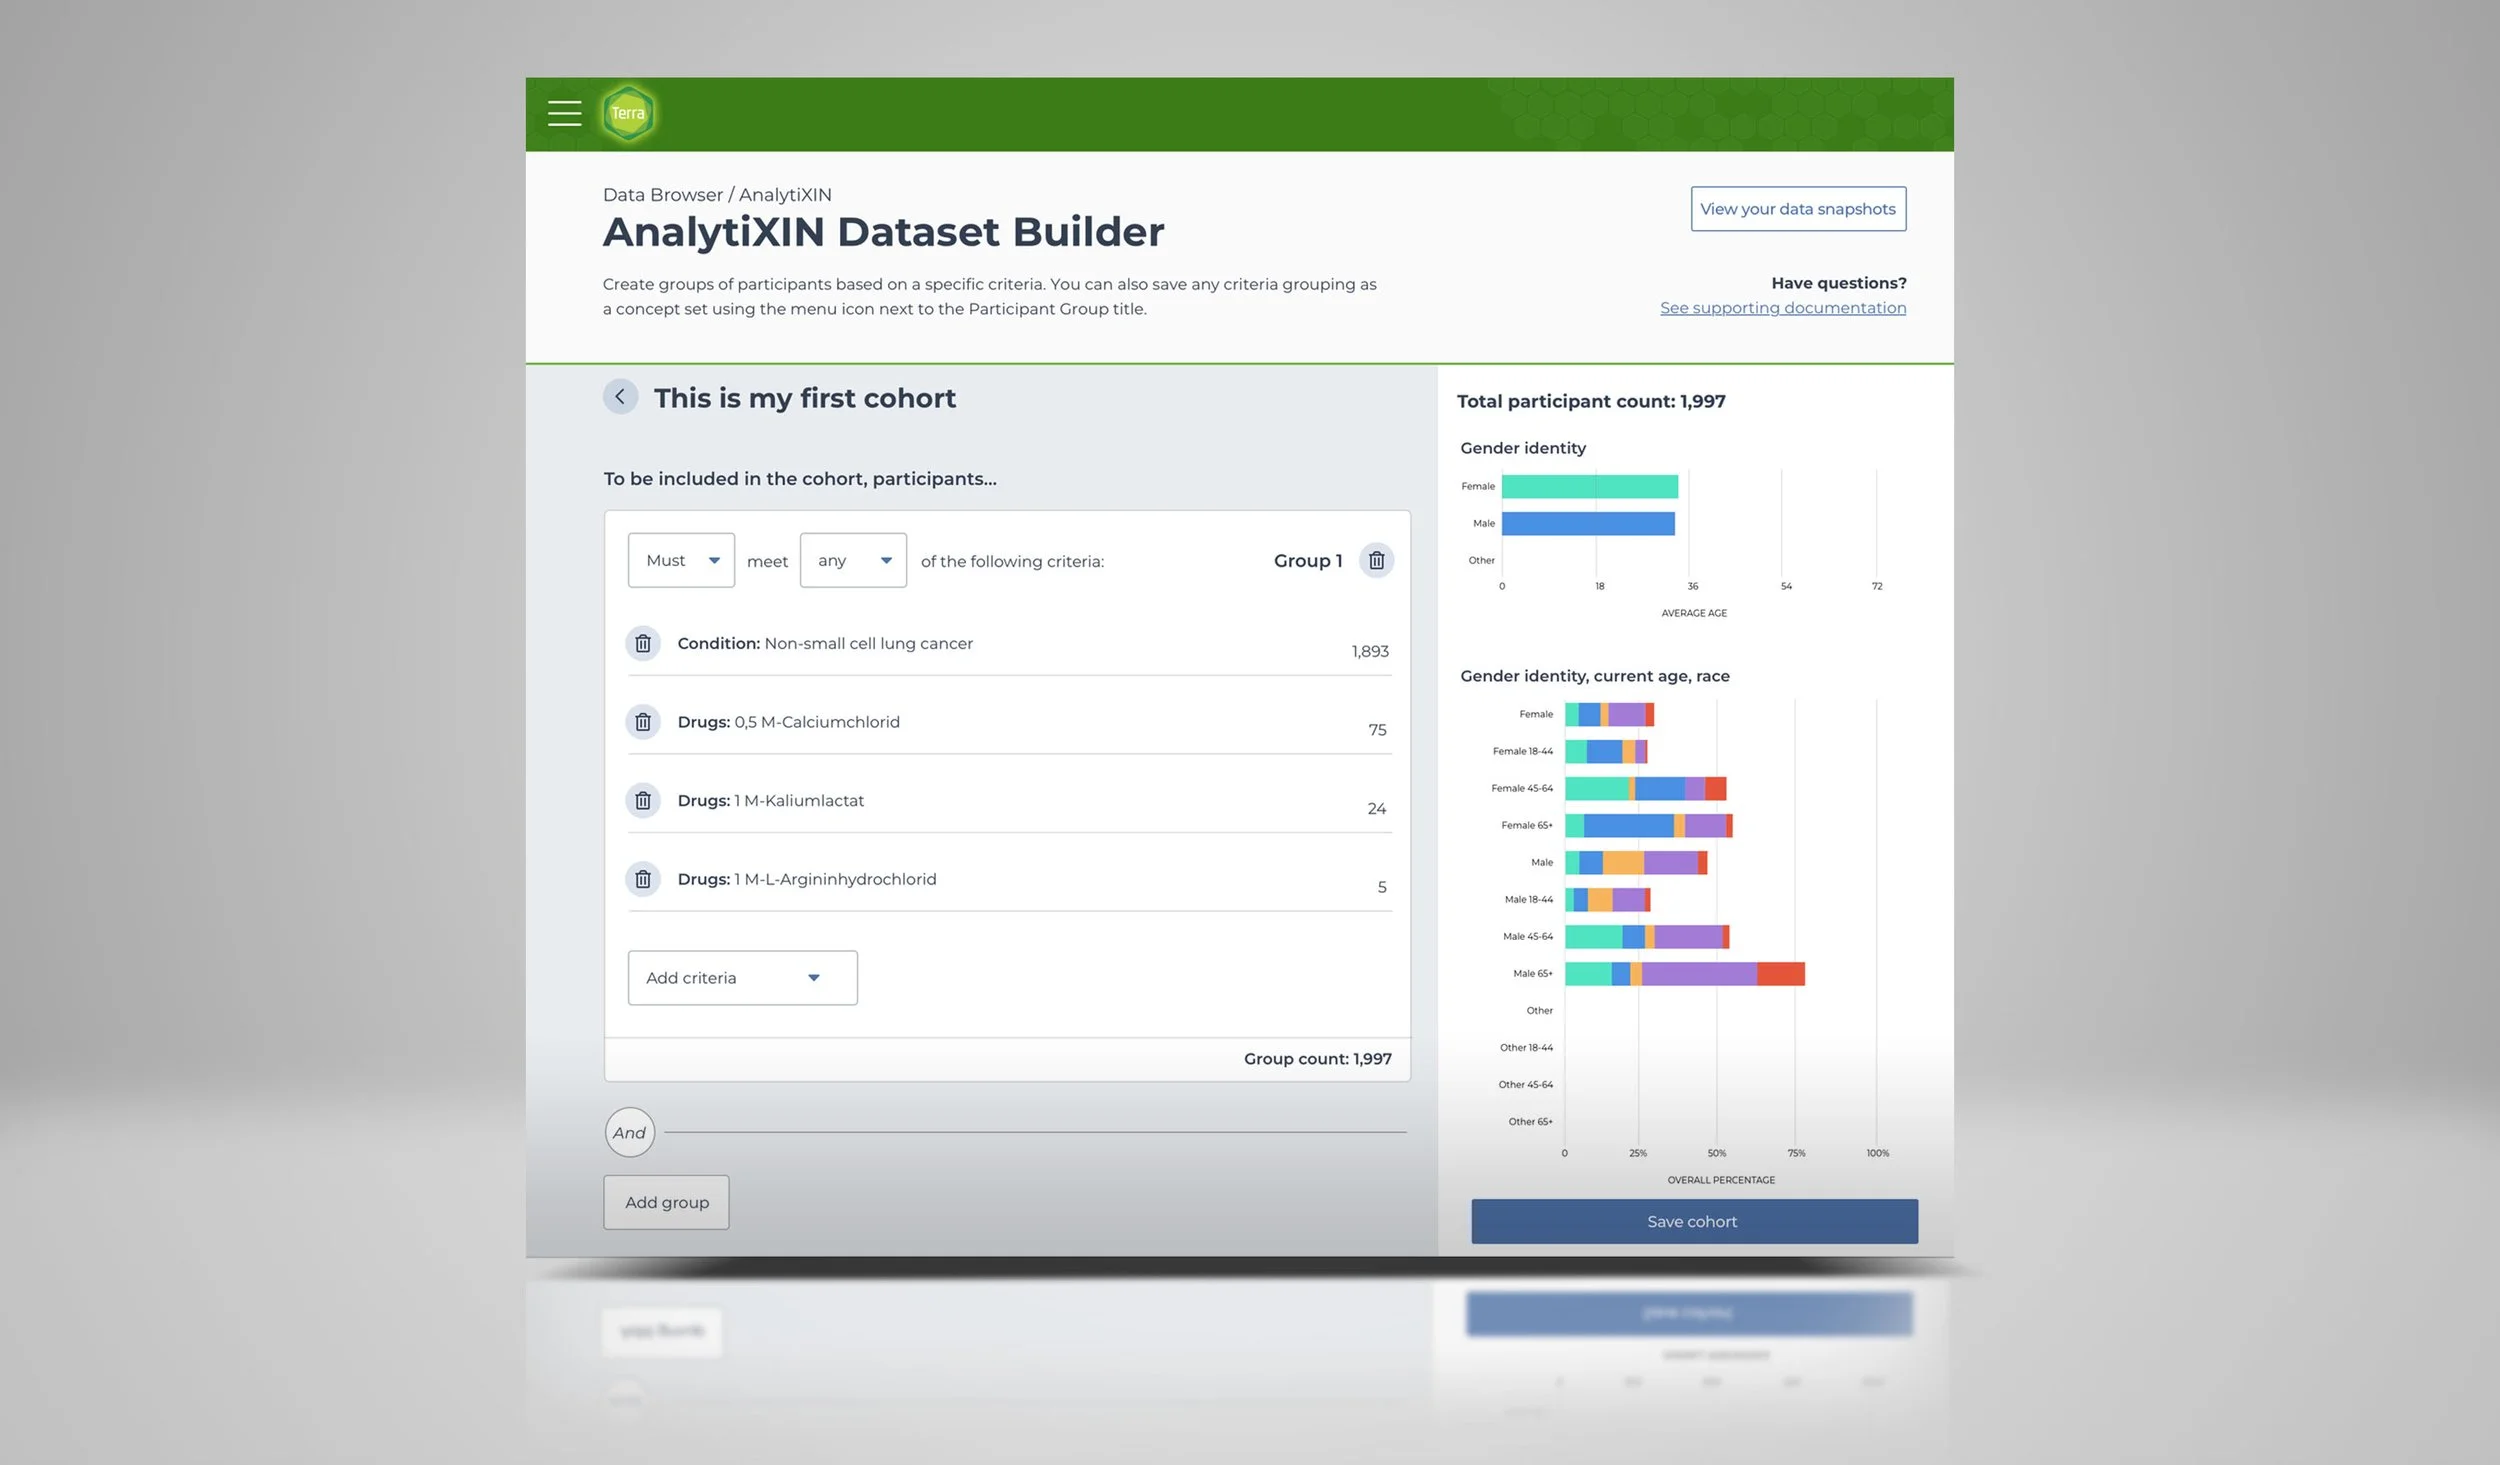
Criteria selection grouping
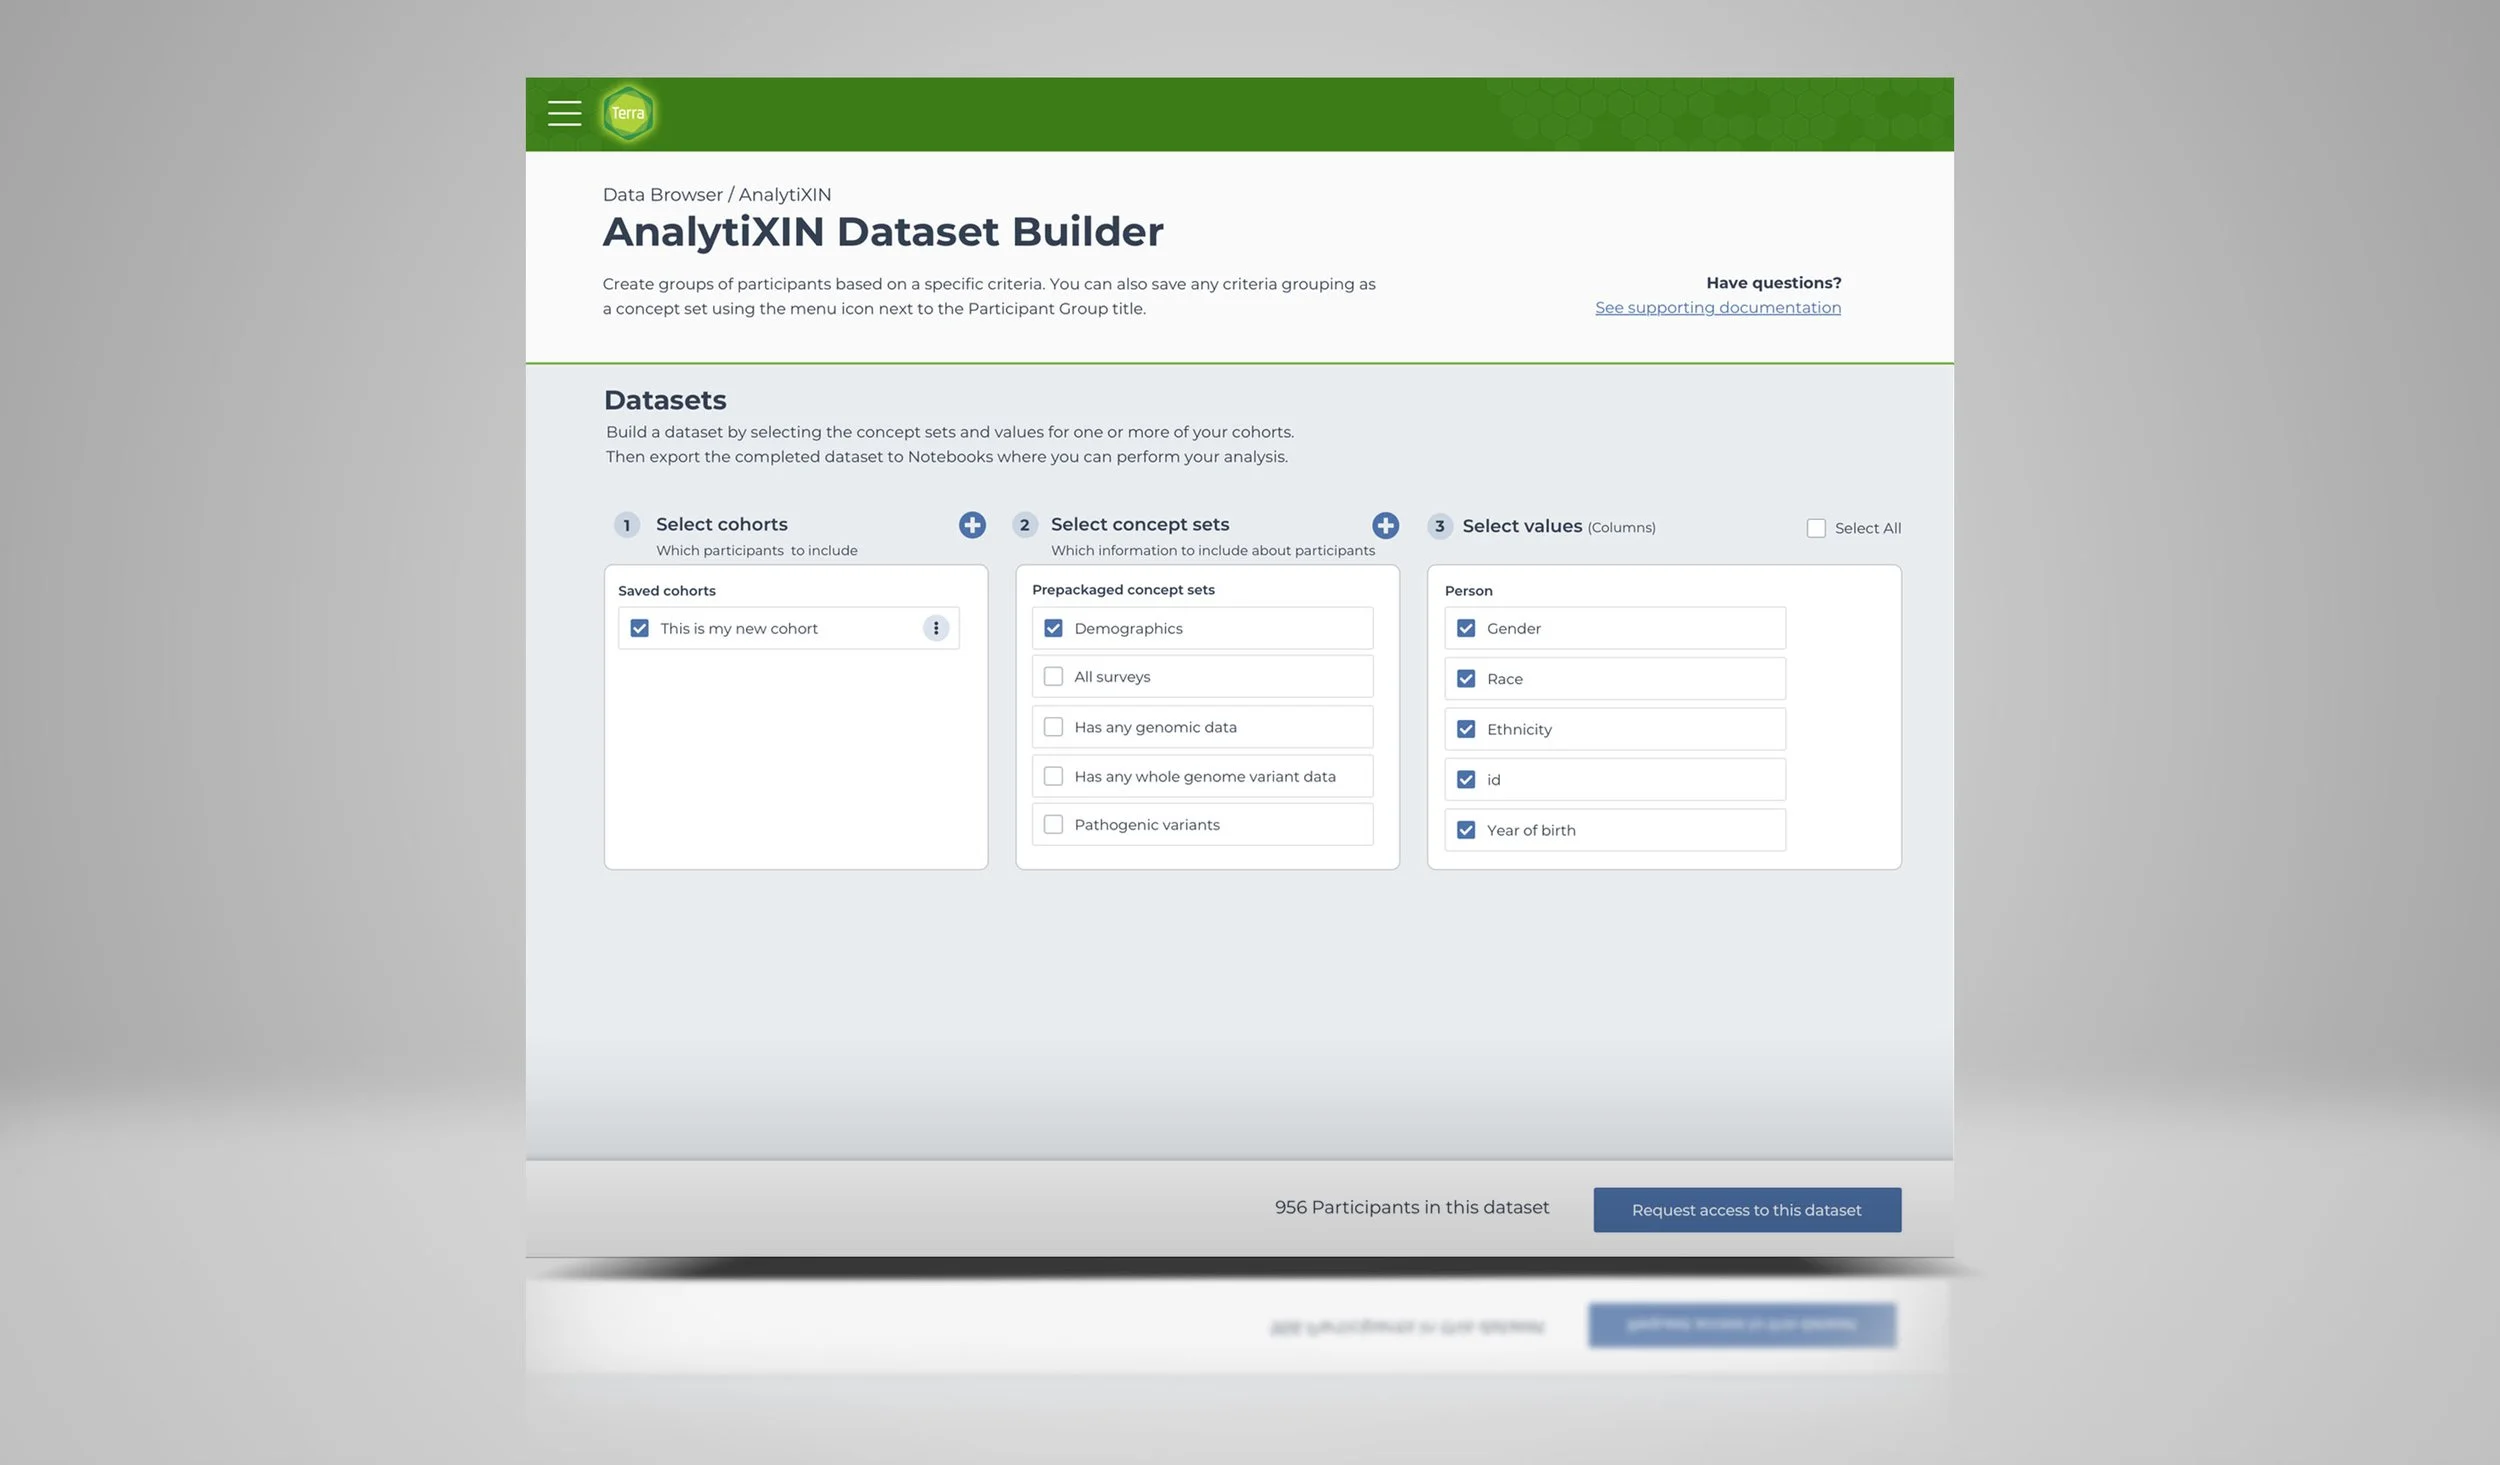
Combining cohorts with concept sets to create dataset to import to a workspace
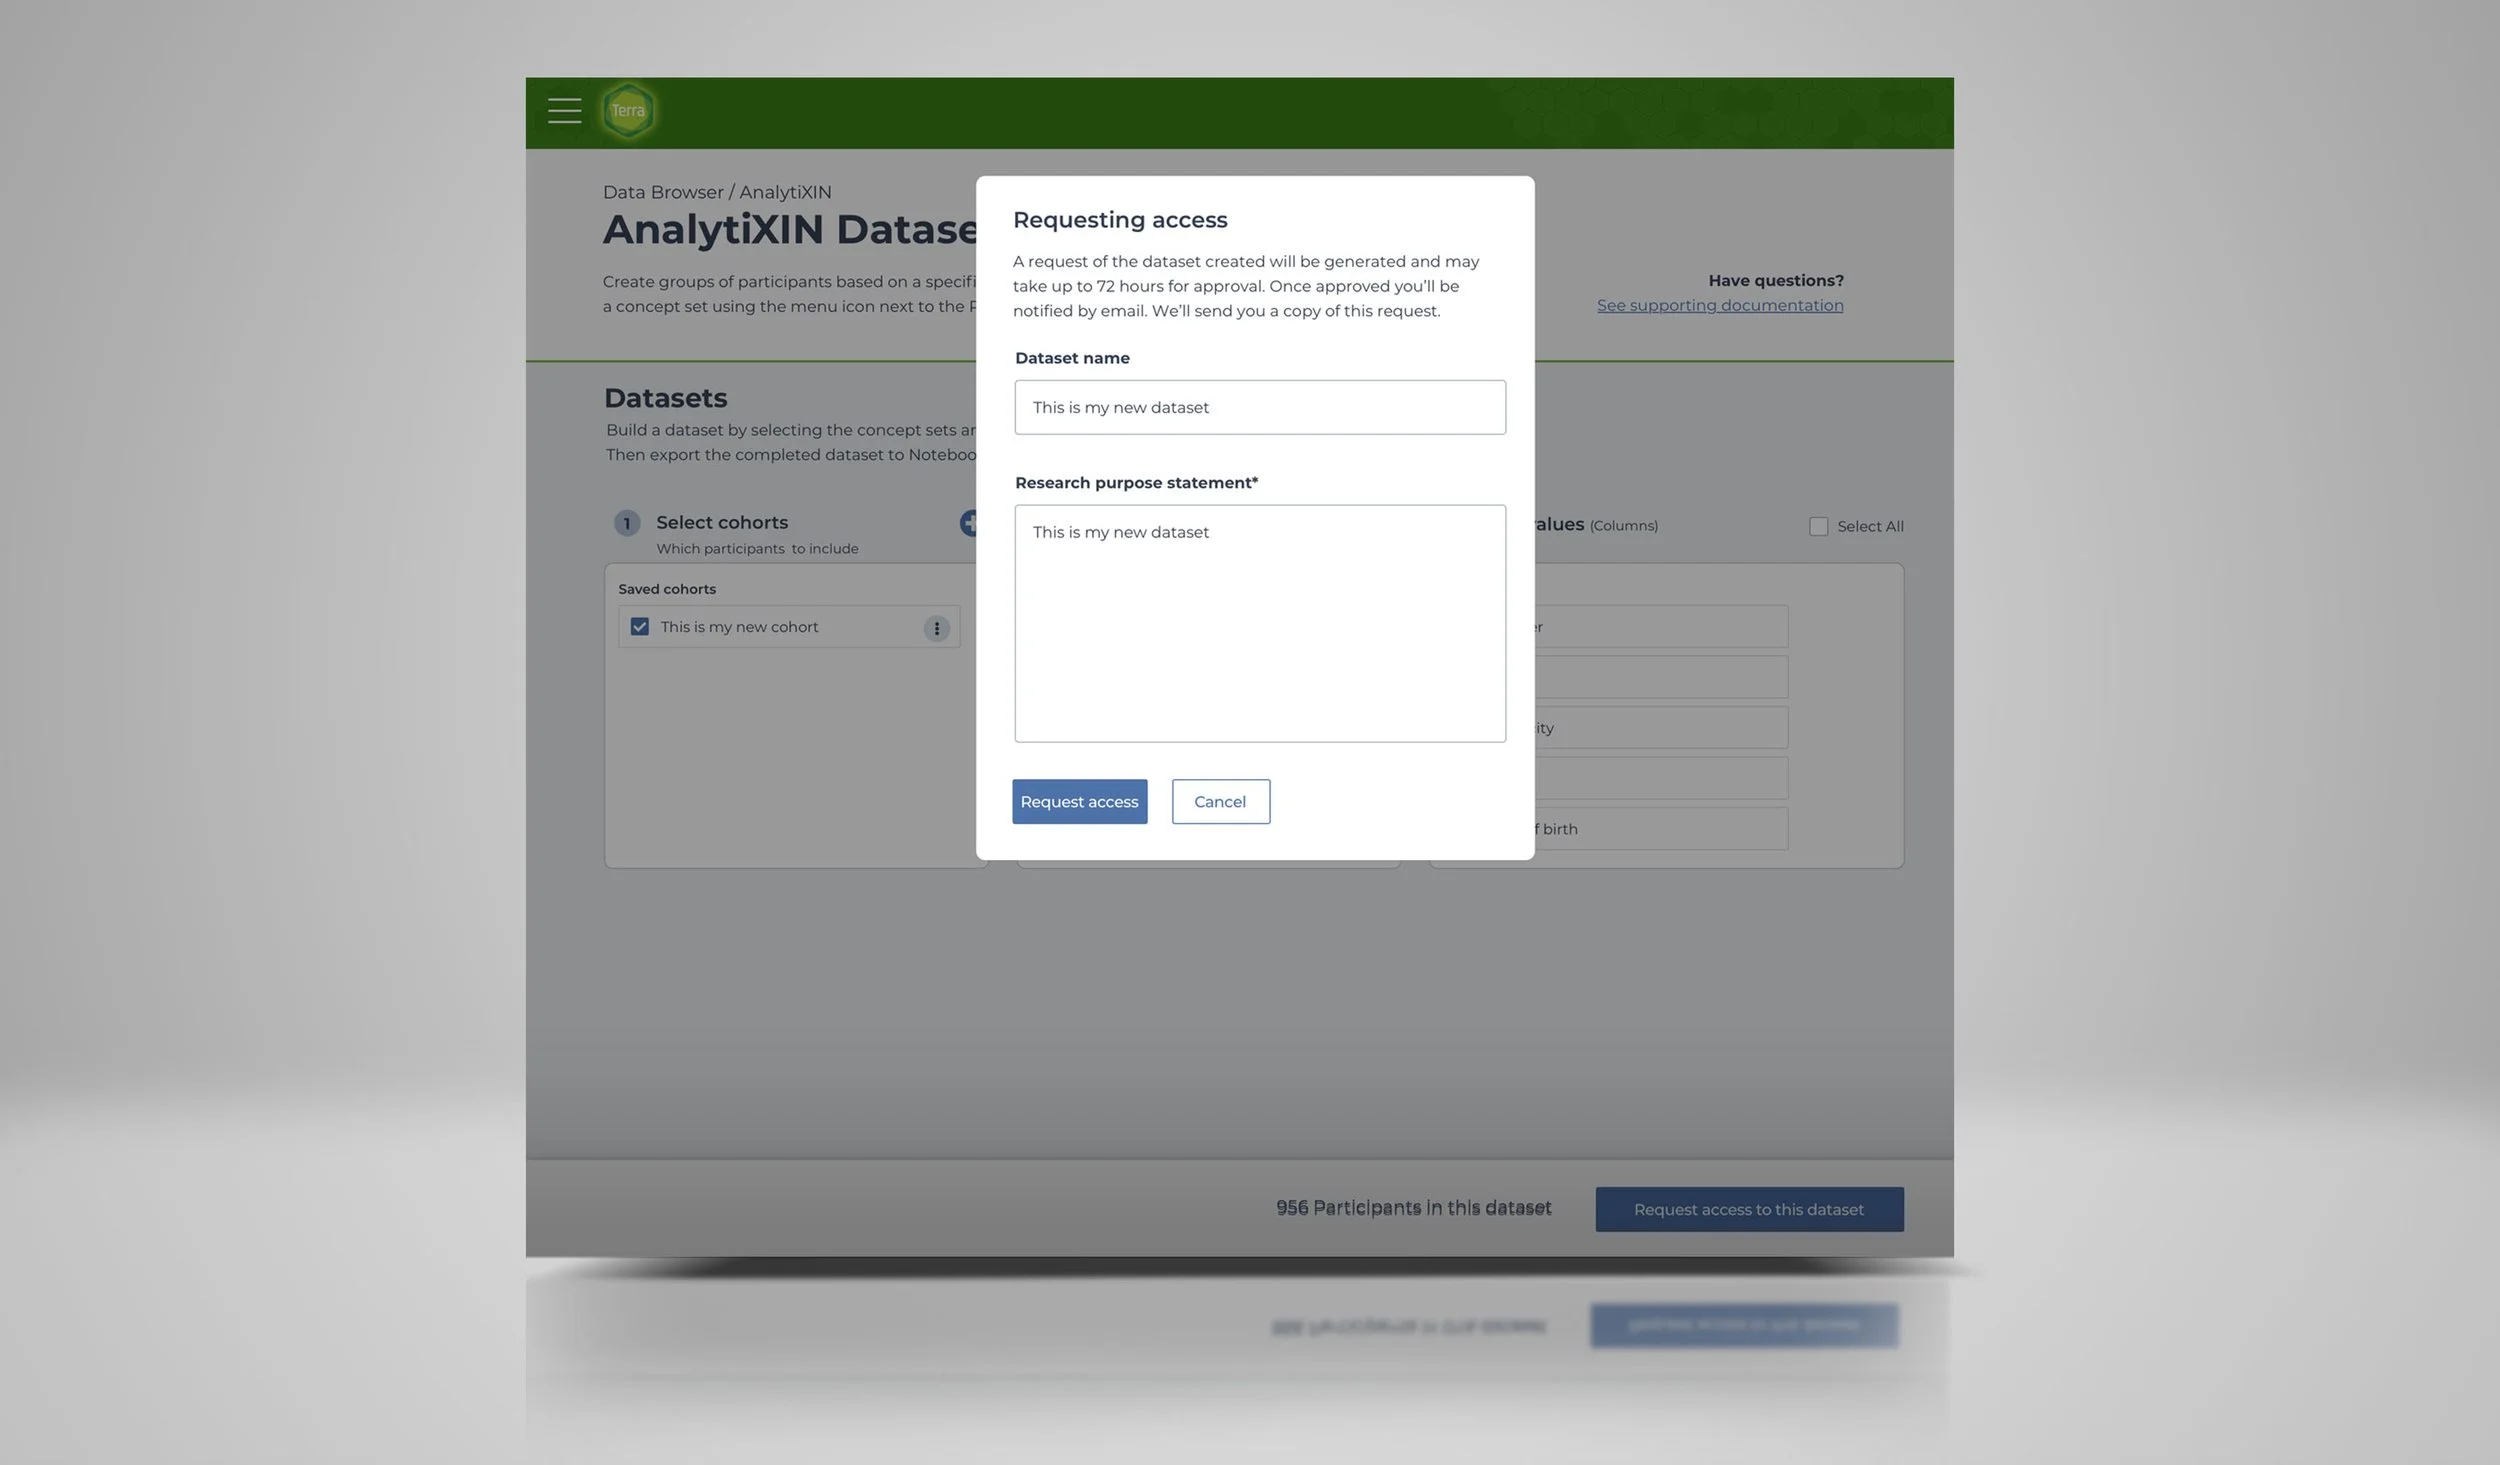
Requesting access to import into a workspace
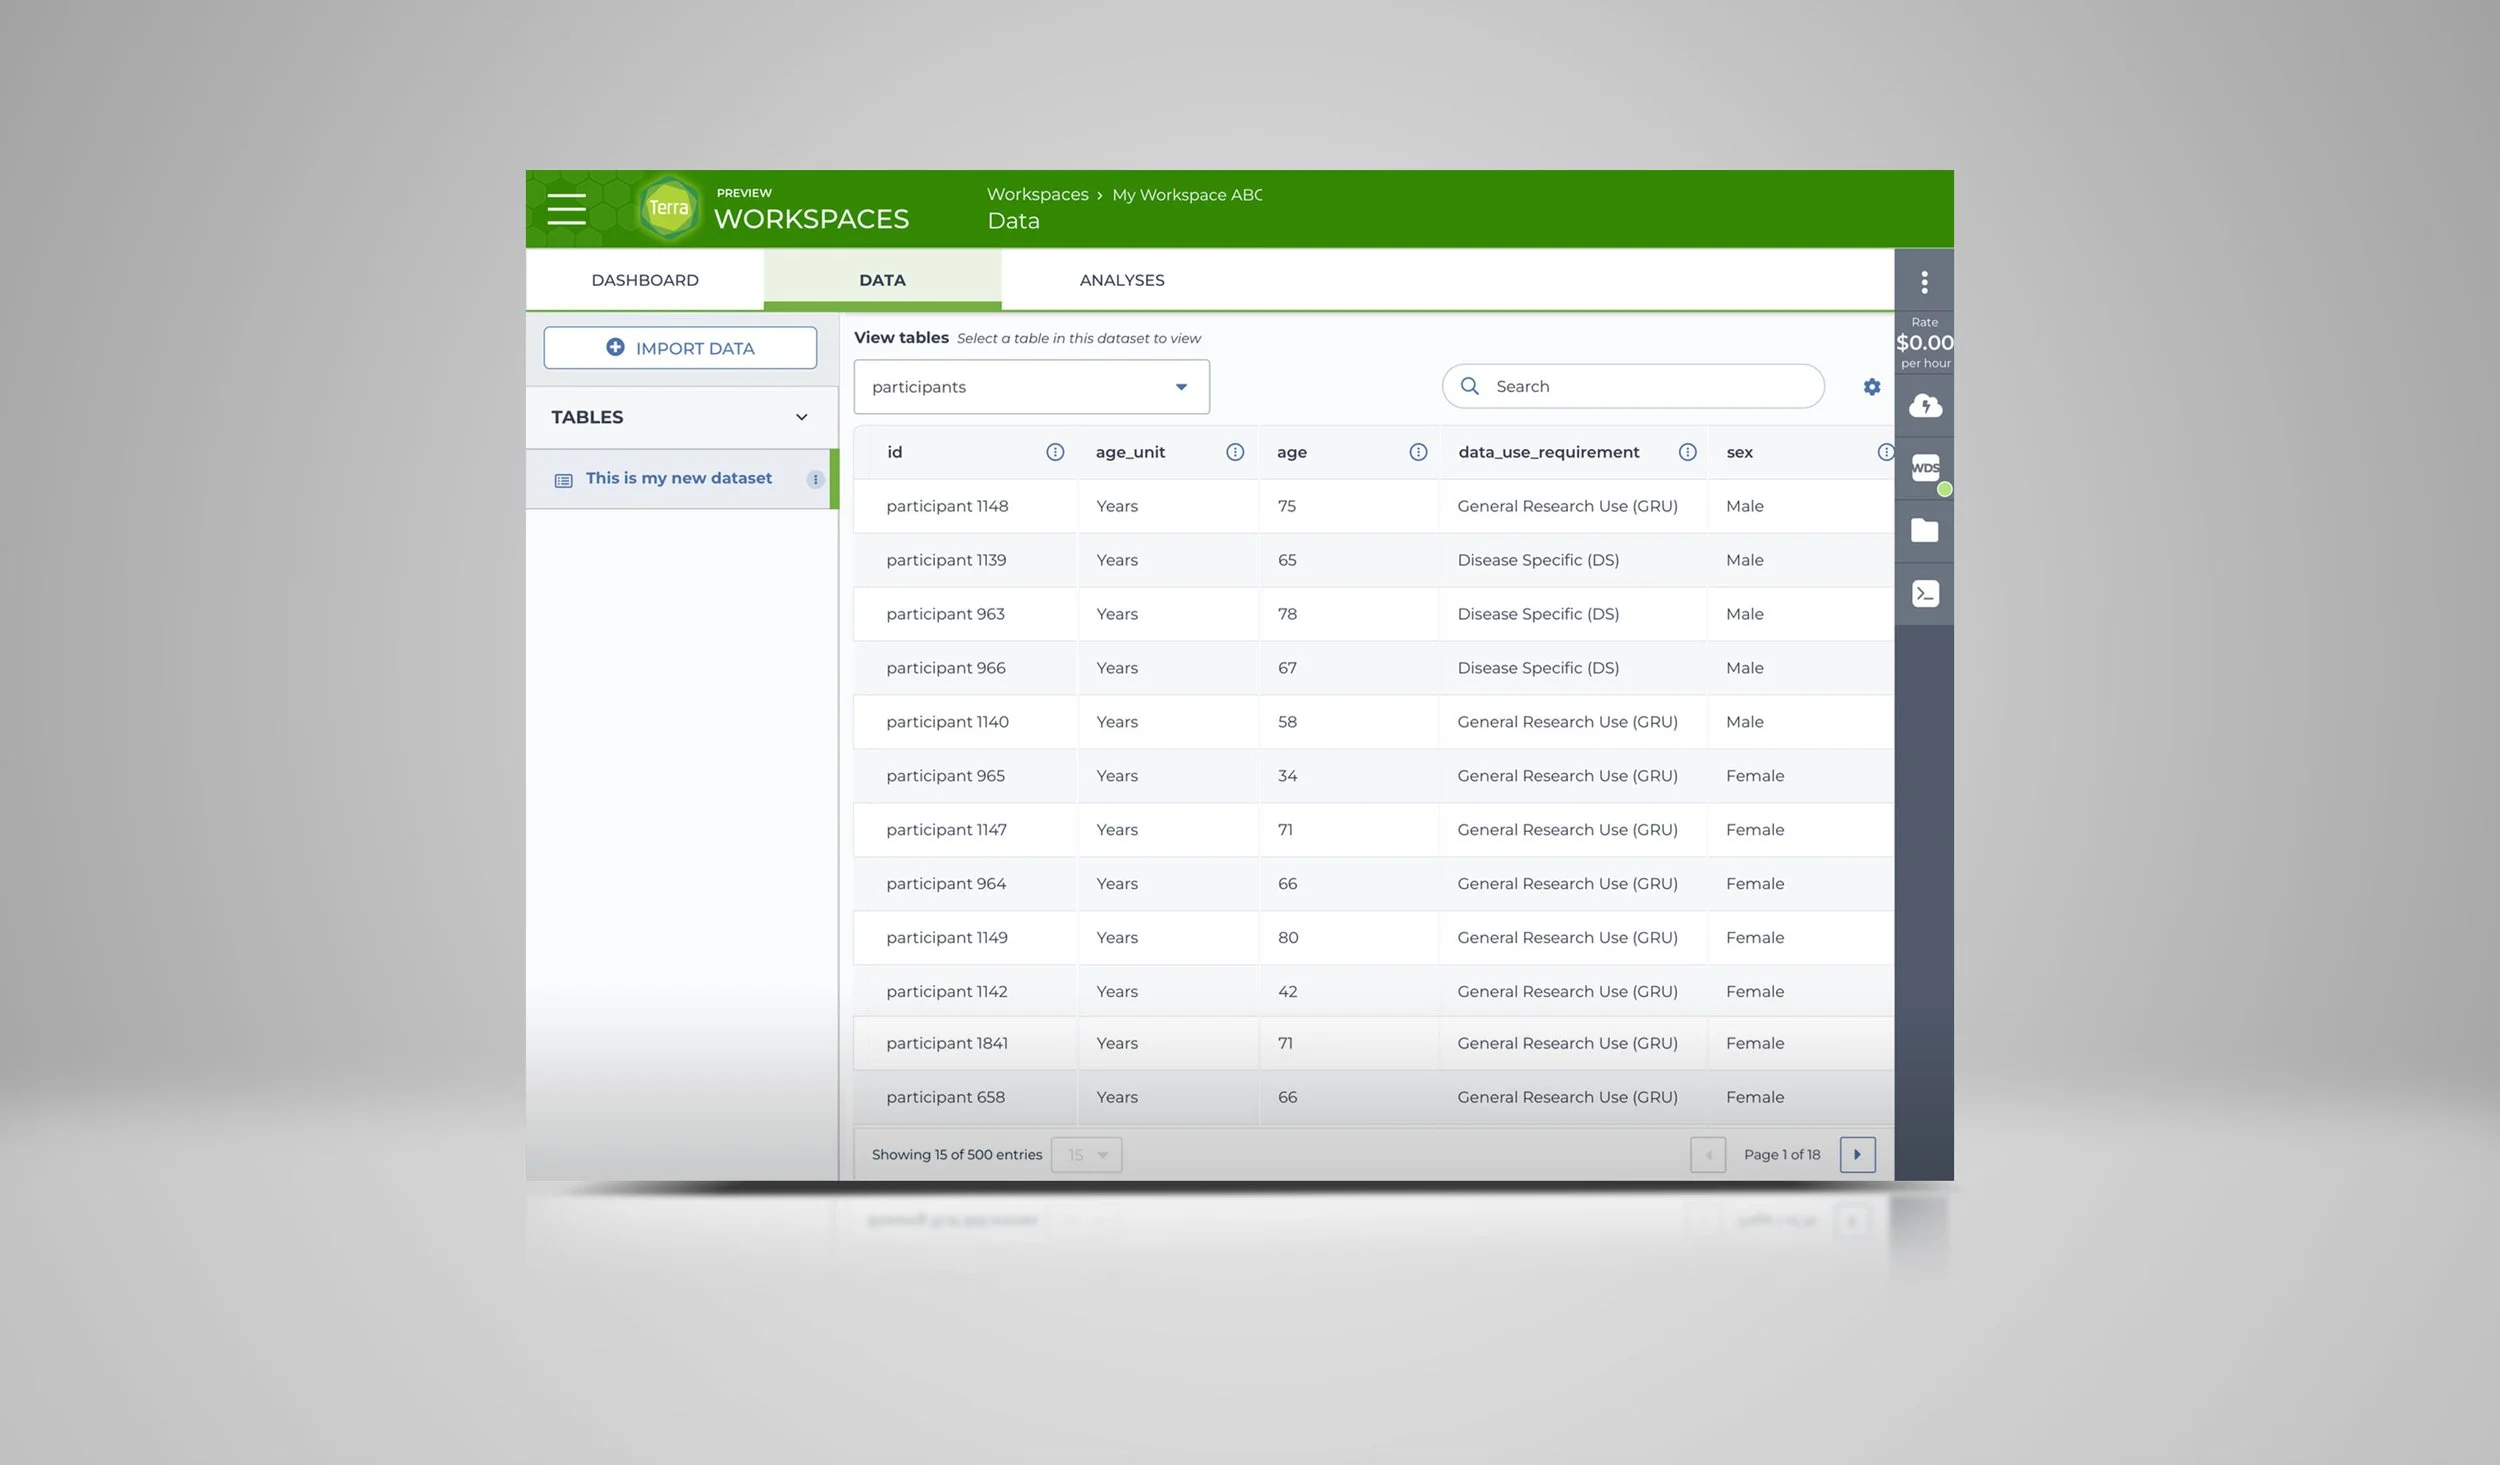
Dataset created in the cohort builder is in a workspace